Fig. 1.

Impaired erythropoiesis in IEX-1 KO mice.
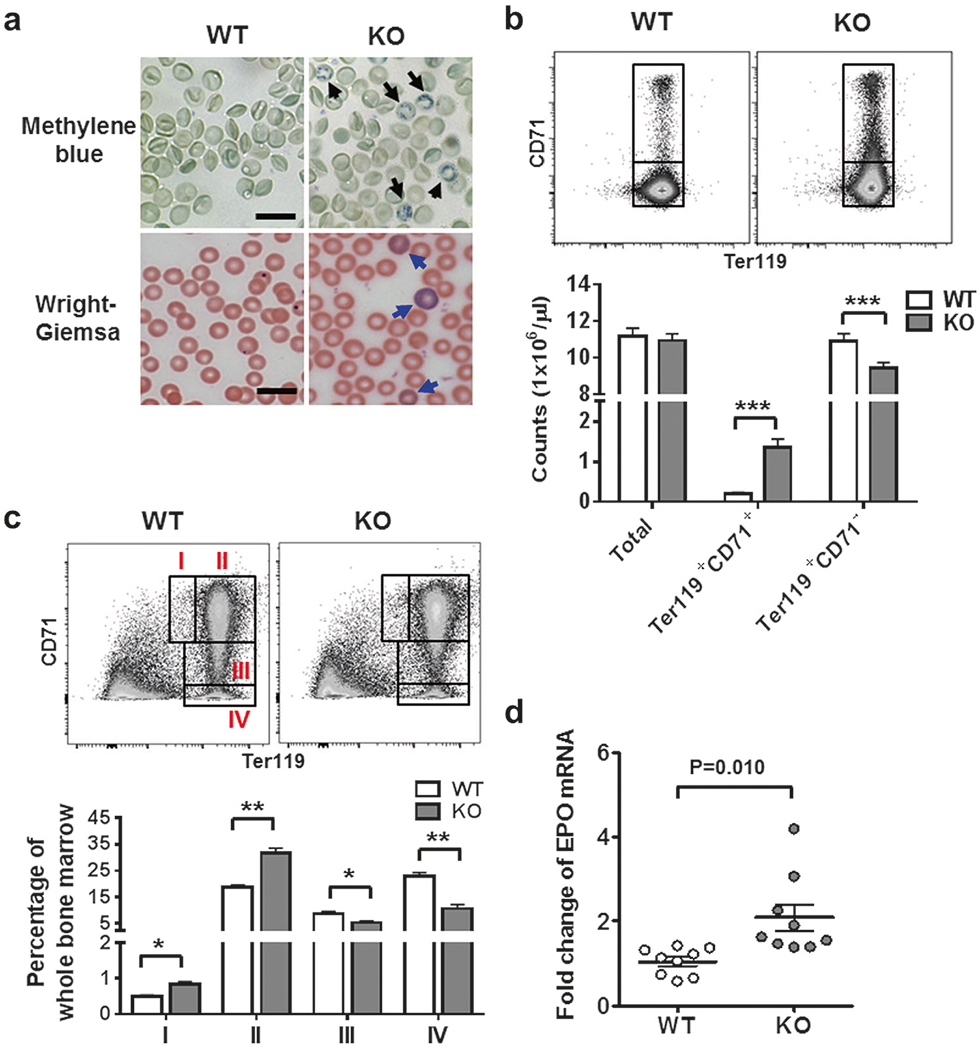
a, b Reticulocytosis in IEX-1 KO mice. Shown in a are representative images of increased reticulocytes marked by Methylene blue (black arrows) and polychromasia stained by Wright-Giemsa (blue arrows) in blood smears from at least 9 mice per group. Scale bar, 20 μm. Peripheral blood cells were stained with Ter119 vs. CD71 and subjected to cell counts by flow cytometry (upper) and statistical analysis of the data (lower) (b).
c, d Compensatory expansion of erythroid precursors in KO mice. Bone marrow cells were stained with Ter119 vs. CD71 and the gates I to IV depict erythroid cell populations with an increasing degree of maturation (c).
Distributions of cells within individual gates, as defined in the upper, were presented as percentages of cells over total bone marrow cells (lower). Erythropoietin (EPO) was quantified by qRT-PCR in mouse kidneys (d). Data are shown as mean ± SEM for all relevant panels. n = 9, *P < 0.05, **P < 0.01, and ***P < 0.001 compared between WT and KO groups
