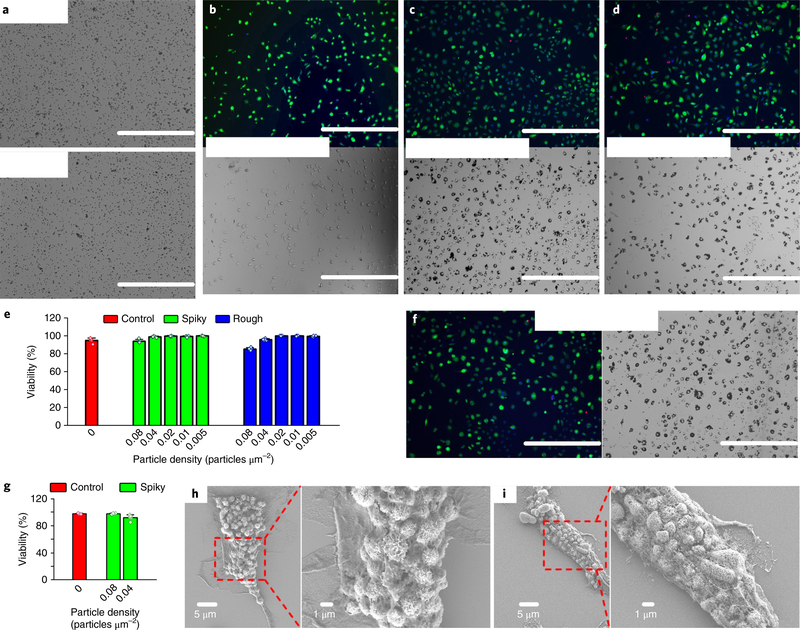
Fig. 2 |. BMM viability and cell–particle interface study.
a, Optical images of spiky (top) and rough (bottom) particles at a typical dose of 0.04 particles μm−2. Scale bars, 200 μm. b-d, Fluorescence (top) and optical (bottom) images of BMMs after incubation without particles (b), or with spiky particles (c) or rough particles (d) at 0.04 particles μm−2 for 48h. The assay stained live cells with calcein (green), dead cells with ethidium bromide (red) and cell nuclei with Hoechst (blue). Scale bars, 400 μm. e, Macrophage viability after incubation with the indicated particles at different doses for 48h. n = 5 biologically independent samples. f, Fluorescent (left) and optical (right) images of BMMs after incubation with spiky particles at 0.04 particles μm−2 for 96 h. Scale bars, 400 μm. g, Macrophage viability after incubation with spiky particles at the indicated doses for 96h. n = 5 biologically independent samples. h,i, SEM images that show BMMs interfaced with spiky particles (h) and rough particles (i). The particles were observed to be engulfed or fully internalized. All the experiments were repeated twice with similar results. Statistical data presented as the mean± s.d.

