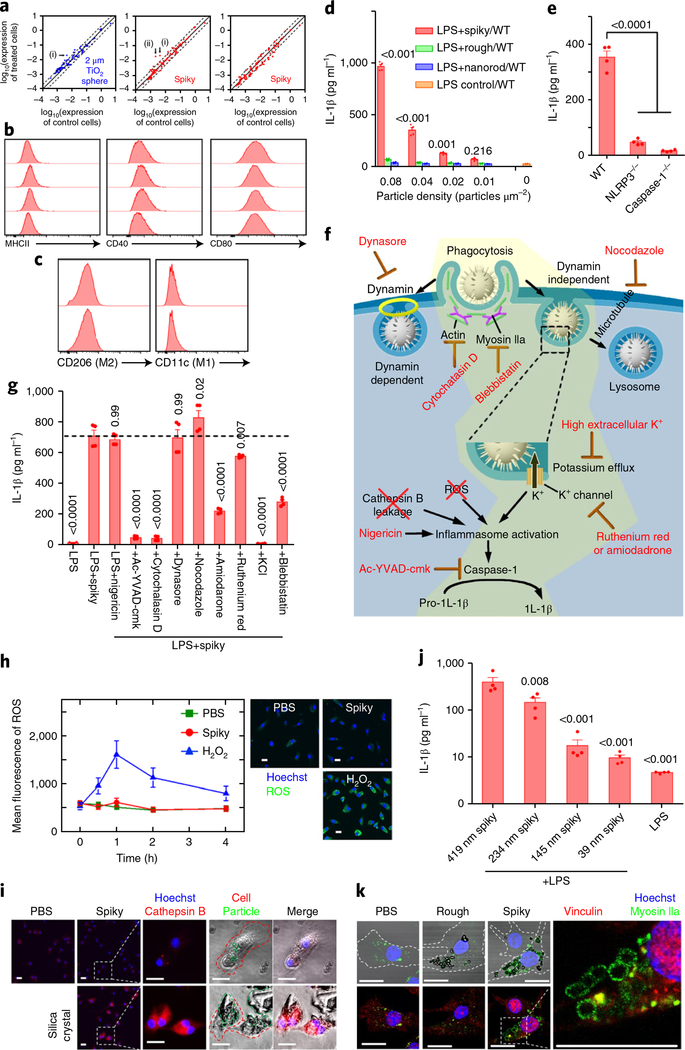
Fig. 4 |. Spiky particles activate inflammasomes.
Particle concentrations were 0.04 particles μm−2 in all the studies except for d. a, Expression levels of 89 genes, which include cytokines, chemokines, cytokine/chemokine receptors and activation markers, were analysed by quantitative real-time RT-PCR after BMMs were cultured with control particles (2 μm TiO2 microspheres) (left) or spiky particles (centre and right) for 12 (left and centre) or 48 h (right). Solid lines indicate no significant changes between the control and treated cells, whereas the dashed lines indicate twofold up- or downregulation. The genes CD28 (i) and CXCL2 (ii) were altered by spiky particle treatments, but CD28 was also slightly upregulated by the control particle treatment. b, Cell activation markers CD40, CD80 and MHCII were analysed by flow cytometry after the BMMs were incubated with spiky (second row) or rough (third row) particles or nanorods (bottom row) for 12 h (the top row is the control). c, Cell differentiation into CD11c+ (M1 marker) or CD206+ (M2 marker) was analysed in BMMs incubated with spiky particles for 12 h (bottom; top is the control). d, The release of IL-1β owing to inflammasome activation was analysed by ELISA. n = 4 biologically independent samples. BMMs from the WT were primed with LPS for 3 h followed by incubation of the cells with the indicated doses of spiky particles, rough particles or nanorods for another 18 h. e, Spiky particle-induced inflammasome activations of BMMs from WT, caspase-1−/− or NLRP3−/− mice were analysed by ELISA. n = 4 biologically independent samples. f, Illustration of possible inflammasome activation mechanisms. The yellow region indicates a feasible mechanism supported by the experiments. g, Elucidation of the mechanism of the underlying inflammasome activation evoked by spiky particles. BMMs were pretreated with the indicated inhibitors for 0.5 h and treated with LPS and spiky particles. The dotted line indicates the mean of the LPS+spiky group. n = 4 biologically independent samples. h, ROS levels after incubation with spiky particles, or with H2O2 as the positive control. ROS levels at different time points are shown (left) and representative images were obtained 1 h after particle incubation (right). Green fluorescence indicates ROS production (blue is Hoechst). Scale bars, 20 μm. n = 10 images. i, The release of cathepsin B (red fluorescence) indicated a frustrated phagocytosis and lysosome disruption. BMMs were incubated for 3 h with spiky particles, or with silica crystals as the positive control. The red dashed lines indicate a cell border, and the green dashed lines indicate particles or silica crystals. Scale bars, 20 μm. j, The particles with different spike lengths (419 ± 83, 234 ±56,145 ± 42 and 39 ± 17nm) were cultured with BMMs in the presence of LPS as in d. IL-1β levels were measured by ELISA. n = 4 biologically independent samples. k, Recruitment of myosin IIa is shown by green fluorescence around the phagocytized particles. BMMs were cultured with rough or spiky particles for 5 h, after which vinculin was labelled with red fluorescence. The dashed line indicates a cell border. Scale bars, 20 μm. Data are presented as the mean± s.e.m. All the experiments were repeated three times with similar results. The significance was calculated by one-way ANOVA compared to the LPS control in d, to the WT mice in e, to LPS+spiky in g or to 419nm spiky+LPS in j.

