FIGURE 1.

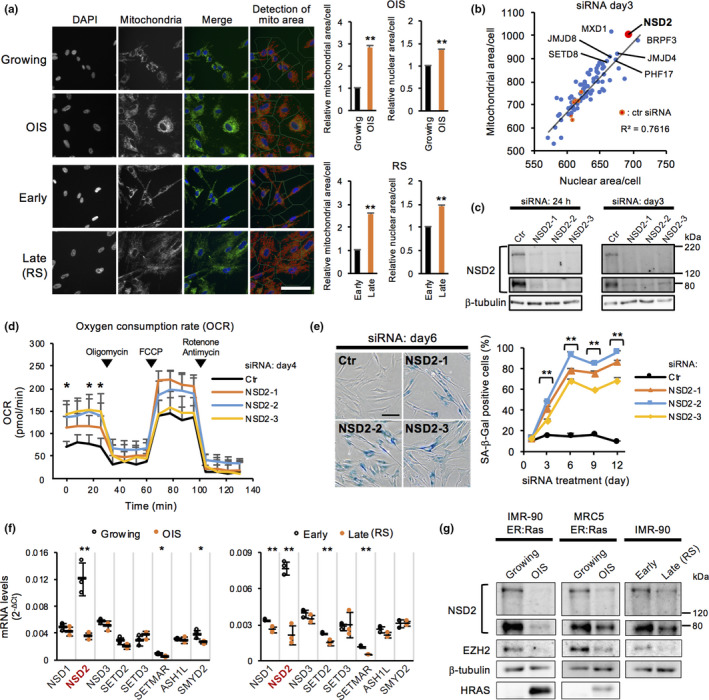
RNAi‐based screen revealed that loss of NSD2 induces mitochondrial activation and cellular senescence. (a) Immunofluorescence of mitochondria in IMR‐90 human fibroblasts with oncogene‐induced senescence (OIS) and replicative senescence (RS). OIS cells were induced by treating IMR‐90 ER:Ras cells with 100 nM 4‐OHT for 6–8 days. RS cells were prepared by repeated passages for 10–12 weeks (Tanaka et al., 2017). To assess mitochondrial signals, the total area of fluorescence signals per cell was calculated in growing, OIS, early passaged, and late passaged (RS) cells (each n > 600 cells). Data are shown as means ± SD; n = 3. Scale bar, 100 μm. (b) Scatter plot between mean mitochondrial area and mean nuclear area in each knockdown cell. Data are shown as means ± SD; n = 3. (c) Western blot analysis of NSD2 at 24 hr and day 3 in Ctr‐ and NSD2‐KD IMR‐90 cells. (d) OCR on day 4 in Ctr‐ and NSD2‐KD IMR‐90 cells. Data are shown as means ± SD; n = 4. Respiratory chain inhibitors were serially added to the culture at the indicated time points. Statistical analysis was performed between control siRNA and each NSD2 siRNA. (e) SA‐β‐Gal staining on days 1–12 in Ctr‐ and NSD2‐KD IMR‐90 cells (each n > 300 cells). Data are shown as means ± SD; n = 3. Scale bar, 100 μm. Statistical analysis was performed between control siRNA and each NSD2 siRNA. (f) qRT‐PCR of NSD2 and other known H3K36 methyltransferases in growing, OIS, early passaged, and late passaged (RS) IMR‐90 cells. Data are shown as means ± SD; n = 3. (g) Western blot analysis of NSD2 in growing, OIS, early passaged, and late passaged (RS) IMR‐90 and MRC5 human fibroblasts. *p < .05, **p < .01, using Student's t test
