FIGURE 4.

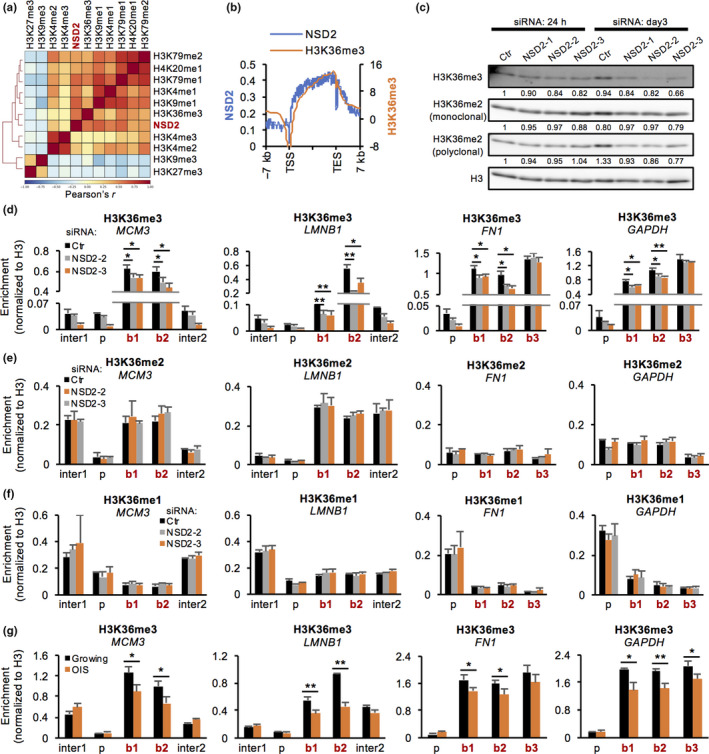
Loss of NSD2 alters the levels of H3K36 trimethylation at NSD2‐enriched gene bodies. (a) Heatmap showing a genome‐wide correlation between NSD2 and histone methylations in IMR‐90 cells. Histone modification data were obtained from ENCODE datasets. (b) Distribution of NSD2 and H3K36me3 around gene loci. (c) Western blot analysis of H3K36me3 and H3K36me2 at 24 hr and day 3 in Ctr‐ and NSD2‐KD IMR‐90 cells. The intensity of bands was calculated using ImageJ and normalized to H3 and then to Ctr‐KD of 24 hr. (d–f) ChIP‐qPCR of H3K36me3, me2, or me1 at intergenic (inter), promoter (p), and gene body (b) of indicated gene loci at 24 hr in Ctr‐ and NSD2‐KD IMR‐90 cells. Primers used are shown in Figure 3b. Data are shown as means ± SD; n = 3. (g) ChIP‐qPCR of H3K36me3 at intergenic (inter), promoter (p), and gene body (b) of indicated gene loci in growing and OIS IMR‐90 cells. Primers used are shown in Figure 3b. Data are shown as means ± SD; n = 3. *p < .05, **p < .01, p‐values were calculated using Student's t test
