FIGURE 6.

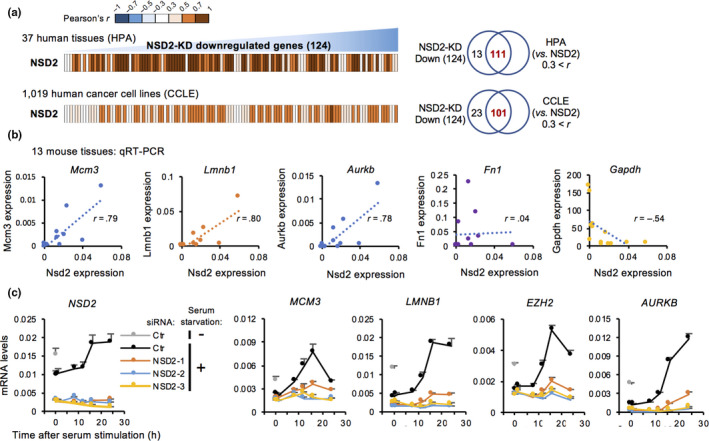
NSD2 is controlled in a cell cycle‐dependent manner and is required for the expression of late serum response genes. (a) Heatmaps showing the correlation between mRNA expression levels of NSD2 and genes downregulated in NSD2‐KD IMR‐90 cells in 37 human normal tissues and 1,019 human cancer cell lines. Data were obtained from the Human Protein Atlas (HPA) and Cancer Cell Line Encyclopedia (CCLE). Venn diagrams showing the number of positively correlated genes among genes downregulated in NSD2‐KD IMR‐90 cells in HPA or CCLE. (b) Scatter plots showing the correlation of gene expression between Nsd2 and Mcm3, Lmnb1, Aurkb, Fn1, or Gapdh in 13 normal tissues from 7‐week‐old male mice. Data are shown as means ± SD; n = 3. (c) qRT‐PCR of NSD2, MCM3, LMNB1, EZH2, and AURKB during serum stimulation in IMR‐90 cells. 36B4 was used for normalization. Data are shown as means ± SD; n = 3. *p < .05, **p < .01, calculated using Student's t test
