Figure 1.

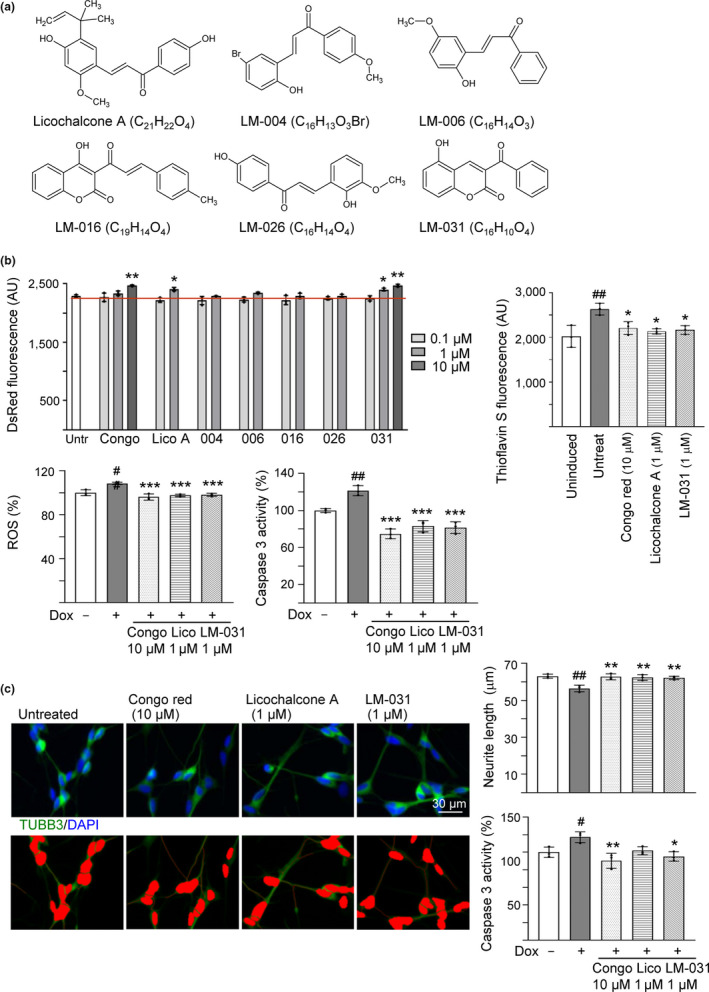
Effects of the test compounds on ΔK280 TauRD‐DsRed 293 and SH‐SY5Y cells. (a) Structure, formula, and molecular weight of licochalcone A and LM compounds 004, 006, 016, 026, and 031. (b) Effects of the test compounds on inhibiting Tau misfolding, ROS production, and caspase 3 activity. ΔK280 TauRD‐DsRed 293 cells were treated with congo red or test compounds (0.1–10 μM) for 3 days. DsRed fluorescence was measured in wells containing at least 80% viable cells (n = 3). In addition, thioflavin S fluorescence, ROS, and caspase 3 activity were measured on cells untreated or treated with congo red (10 µM), licochalcone A (1 µM), or LM‐031 (1 µM) (n = 3). The relative ROS and caspase 3 activity of uninduced cells were normalized (100%). (c) Neuroprotective effects of the test compounds. ΔK280 TauRD‐DsRed SH‐SY5Y cells were treated with congo red (10 µM), licochalcone A (1 µM), or LM‐031 (1 µM) for 7 days, and caspase 3 activity assay was measured (n = 3), with uninduced cells normalized as 100%. TUBB3 (neuronal class III β‐tubulin) staining was performed to quantify the extent of neurite outgrowth (n = 3). Nuclei were counterstained with DAPI. Upper row, merged TUBB3 (green) and DAPI (blue) signals; lower row, images of the neurites and the body (red) outlined for outgrowth quantification. p values in (b) and (c): comparisons between induced and uninduced cells (#: p < .05 and ##: p < .01), or between treated and untreated cells (*: p < .05, **: p < .01, and ***: p < .001). (DsRed and Thioflavin S fluorescence: two‐tailed Student's t test; ROS, caspase 3 activity, and neurite outgrowth: one‐way ANOVA with a post hoc Tukey test)
