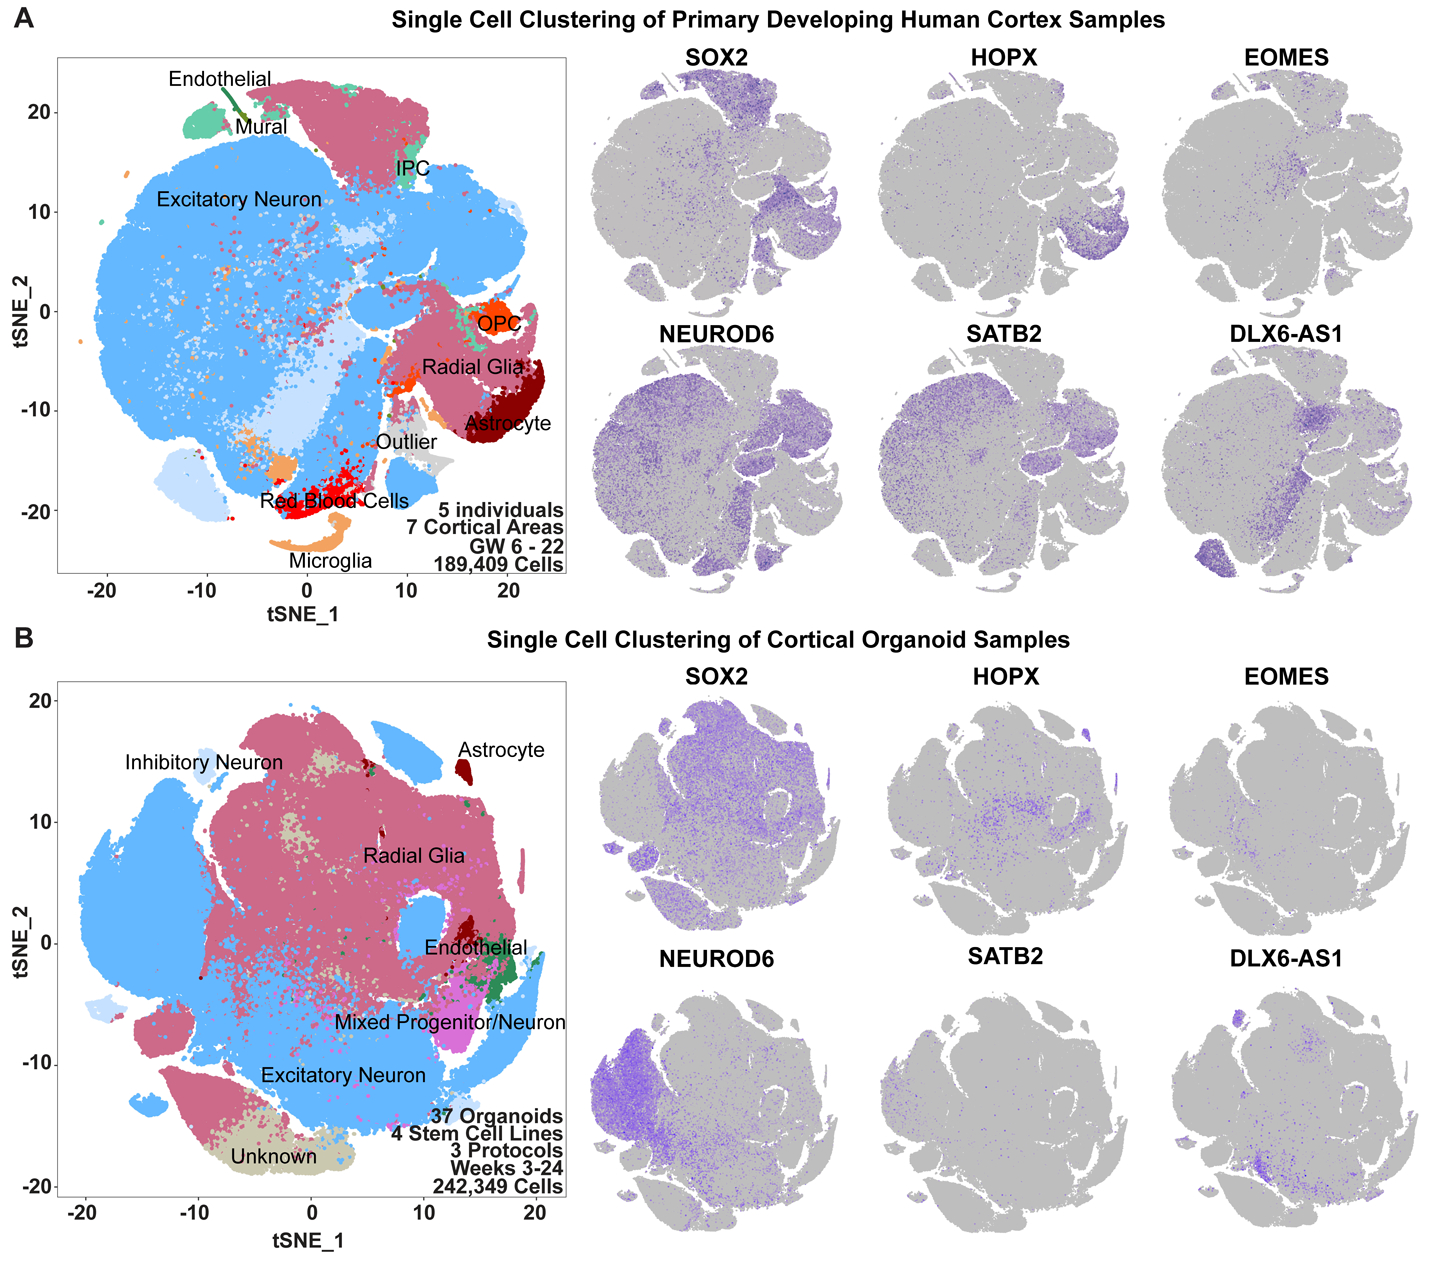
Figure 1. Cell types in Cortical Primary and Organoid Samples.

a) Single-cell sequencing of primary cortical cells identifies a number of cell types. These cell types are labeled in the tSNE plot on the left, and markers of cell type identity depict progenitors (SOX2), outer radial glia (HOPX), intermediate progenitor cells (EOMES), newborn neurons (NEUROD6), maturing neurons (SATB2) and inhibitory interneurons (DLX6-AS1). Single cell data can be explored at: https://organoidreportcard.cells.ucsc.edu. b) Single-cell sequencing of cortical organoid cells generated from four different pluripotent stem cell lines and three protocols with varied levels of directed differentiation generates similar cell types to primary cortex, however the population proportions differ. The proportion of cells for each marker in each sample type are: SOX2+ (primary 15.4%, organoid 41.2%), HOPX+ (primary 7.6%, organoid 4.2%), EOMES+ (primary 4.1%, organoid 1.5%), NEUROD6+ (primary 51.9%, organoid 20.3%), SATB2+ (primary 32.5%, organoid 2.0%), DLX6-AS1+ (primary 17.1%, organoid 3.5%).
