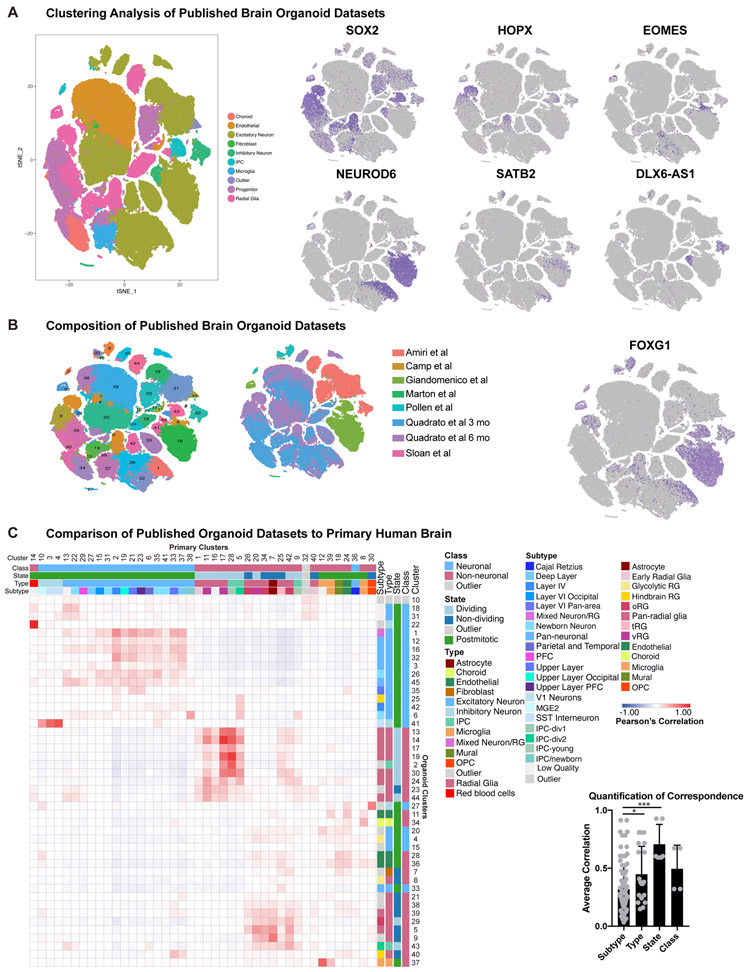
Extended Data Figure 5. Single-cell Comparison of Cell Types Across Published Datasets.
a) Re-analysis of published single-cell sequencing in organoid samples. tSNE plot is colored by cell type designation, while the feature plots depict the same cell populations as presented in Figure 1. b) tSNE plots depicting the single-cell analysis of published organoid cells as colored by cluster, protocol (including paper of origin) and FOXG1 expression. c) Recapitulation of the heatmap in Figure 2, using published organoid clusters from above and comparing to primary reference dataset from this paper. Quantification of correspondence shows the quantitative correlation from the best match in the heatmap for each category of class, state, type and subtype, averaged across all clusters (primary: n=189,409 cells from five individuals collected independently; published organoid data: n=_109,813__cells from 7 data sets collected independently by different scientific groups; two-sided Welch’s t-test evaluating mean plus standard deviation; subtype vs type: * p= 0.0193, subtype vs. state: ***p=0.00017).

