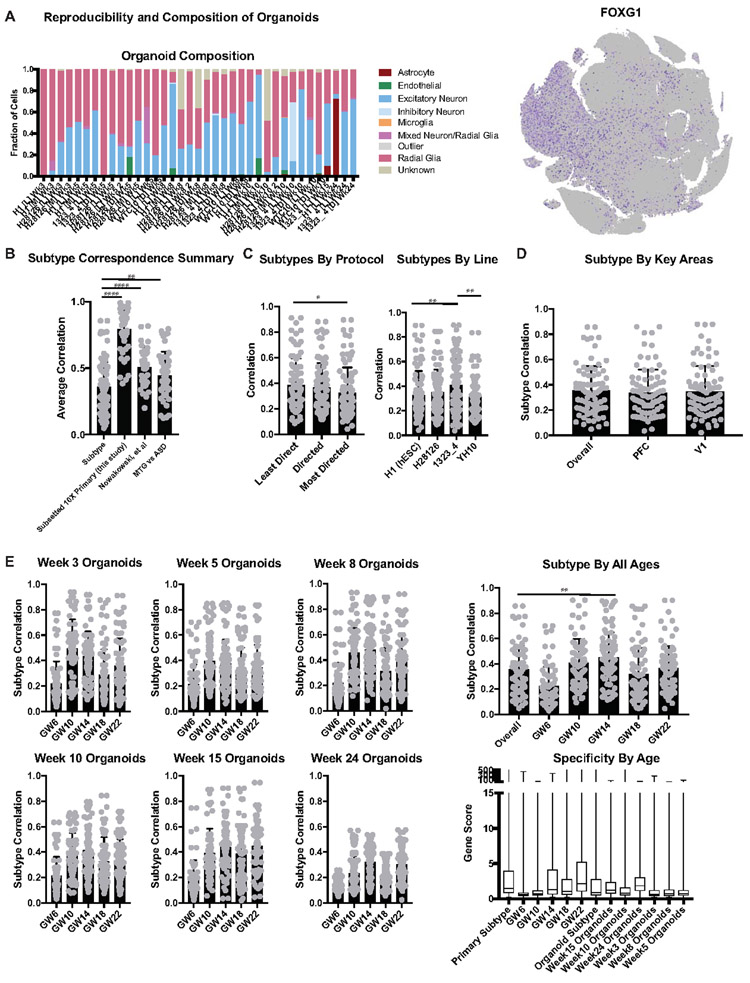
Extended Data Figure 7. Analysis of Subtype Correlation Across Metadata Properties.
a) Composition of each organoid by cell type designation. FOXG1 expression across all organoid samples shown by feature plot on the right. b) Comparison of organoid subtype as determined by this study versus three control analyses. Graphically, the column indicates subtype correspondence and the error bar is standard deviation. The first was performed by halving the primary dataset randomly and without overlap and then comparing the subclusters from the two datasets. This age and method matched analysis shows that primary variation is significantly lower than the variation between organoids and primary cells, as indicated by the significantly higher subtype correlation between primary datasets (organoids: n=242,349 cells collected from 37 organoids from 4 biologically independent samples from 4 independent experiments; primary data: 189,409 cells from 5 biologically independent samples from 5 experiments,****p= 2.0e−24, two-sided Welch’s t-test). A similar analysis was performed comparing the primary data from this study to the data collected by microfluidic approaches from Nowakowski et al. Although the ages, capture method, and number of cells varied greatly, subtype correlation between the published primary data and the data in this study is significantly higher than the subtype similarity between organoids and primary samples (Nowakowski data: n= 4,261 cells from 48 biologically independent samples across more than 35 independent experiments, ****p=2.0e−5). We additionally performed this analysis between two published datasets in the adult human, comparing middle temporal gyrus (MTG, Hodge et al 2019, n= 15,928 cells) from an older adult with distinct brain regions from young adults in the control samples of an autism spectrum disorder study (ASD, Velmeshev et al 2019, n= 104, 559). Despite differences across ages and individuals, who could be expected to have unique cortical gene expression profiles based upon sensory experience, the distinct cortical regions isolated and the different capture methods, the subtype correlation between these two primary datasets is significantly higher than the correlation between organoid cells and primary cells (**p=0.0076). c) Subtype correlation as calculated and shown in Figure 2 which is broken down by protocol and pluripotent line where the graph bars indicate subtype correlation and error bars are standard deviation. The least directed protocol was significantly better at recapitulating cell subtype than the most directed protocol (*p= 0.0483, two-sided Welch’s t-test) which is consistent with the recent findings from Velasco et al. We also observed that the iPSC line 1323_4 generated significantly more similar subtypes to primary samples than WTC10 or H1 (**p=0.0013, 0.0089 respectively). d) Clustering and subtype analysis was performed between all organoids and primary PFC samples and primary V1 individually. Subtype correlation did not change regardless of which area the organoids were compared to. “Overall” refers to the subtype correlation observed when comparing all organoids cells to all primary cells and is shown for comparison. Histogram bars show subtype correlation and error bars are standard deviation (n=242,349 cells from 37 organoids across 4 independent experiments). e) Subtype correlation analysis was performed across all organoid stages (n=week 3: 38,417 cells, week 5: 26,787 cells, week 8: 11,023 cells, week 10: 50,550 cells, week 15: 2,722 cells, week 24: 4,506 cells from 4 independent experiments) and all primary ages (n= GW6: 5,970 cells, GW10: 7,194 cells, GW14: 14,435 cells, GW18: 78,157 cells, GW22: 83,653 cells from 5 independent experiments). Histogram bars show subtype correlation and error bars are standard deviation. Week 3 organoids are more similar to younger primary stages, while week 15 organoids are most similar to older primary ages. Other ages correspond similarly well to the primary stages of peak neurogenesis (GW10-24), while all together, the organoids are most significantly similar to GW14 (**p= 0.0015, two-sided Welch’s t-test). “Overall” refers to the subtype correlation observed when comparing all organoids cells to all primary cells and is shown for comparison. The last histogram shows the average gene score of each sample and error bars are standard deviation. Younger primary samples and organoids have a relatively lower gene score related to their marker specificity; this specificity increases substantially over time in primary cells but less so in organoid cells.

