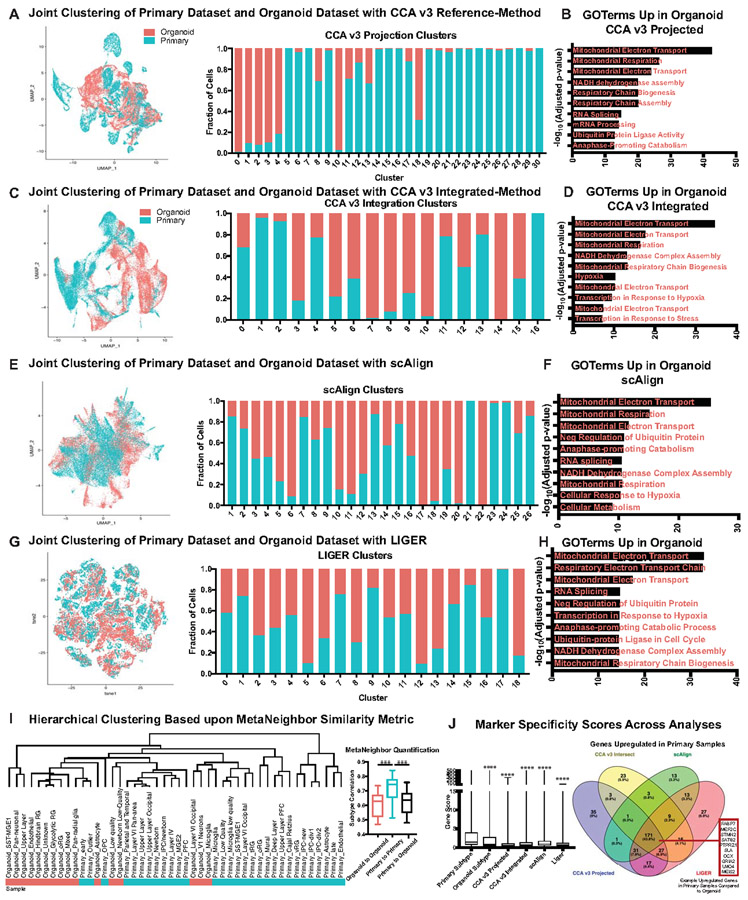
Extended Data Figure 8. Co-clustering of Primary and Organoid Single-cell Datasets with CCA, scAlign, LIGER and MetaNeighbor.
a) Canonical correlation analysis from Seurat v3 was performed using the reference-based integration. For this analysis, 20,000 cells were randomly subsetted from both the primary and organoid datasets and their counts matrices were merged. The primary samples were designated as the reference, and using CCA the organoid cells were projected into that reference space. A UMAP plot of the intersection is shown. The stacked histogram shows the relative contributions of each sample to each cluster. Most clusters were primarily one dataset or the other, validating the observations of limited primary subtype recapitulation in organoids. b) For the clusters with at least 20% contribution from both primary and organoid cells, differential expression was performed across all of these clusters jointly using a two-sided Wilcoxon rank sum test. The full differential expression is presented in STable 5, but genes upregulated in organoid cells were examined with Enrichr pathway analysis, and a summary of the top Gene Ontology terms are presented (organoid: n=20,000 cells from 37 organoids across 4 independent experiments; primary: n=20,000 cells from 5 individuals across 5 independent experiments). c) Canonical correlation analysis from Seurat v3 was performed using the integration based method. For this analysis, 20,000 cells were randomly subsetted from both the primary and organoid datasets and their counts matrices were merged. A UMAP plot of the intersection is shown. The stacked histogram shows the relative contributions of each sample to each cluster. Most clusters were primarily one dataset or the other, validating the observations of limited primary subtype recapitulation in organoids. d) For the clusters with at least 20% contribution from both primary and organoid cells, differential expression was performed across all of these clusters jointly using a two-sided Wilcoxon rank sum test. The full differential expression is presented in STable 5, but genes upregulated in organoid cells were examined with Enrichr pathway analysis, and a summary of the top Gene Ontology terms are presented (organoid: n=20,000 cells from 37 organoids across 4 independent experiments; primary: n=20,000 cells from 5 individuals across 5 independent experiments). e) scAlign was performed for integration of datasets. For this analysis, 20,000 cells were randomly subsetted from both the primary and organoid datasets and their counts matrices were merged. A UMAP plot of the intersection is shown. The stacked histogram shows the relative contributions of each sample to each cluster. Many clusters were primarily one dataset or the other, validating the observations of limited primary subtype recapitulation in organoids. f) For the clusters with at least 20% contribution from both primary and organoid cells, differential expression was performed across all of these clusters jointly using a two-sided Wilcoxon rank sum test. The full differential expression is presented in STable 5, but genes upregulated in organoid cells were examined with Enrichr pathway analysis, and a summary of the top Gene Ontology terms are presented (organoid: n=20,000 cells from 37 organoids across 4 independent experiments; primary: n=20,000 cells from 5 individuals across 5 independent experiments). g) LIGER was performed for integration of datasets. For this analysis, 20,000 cells were randomly subsetted from both the primary and organoid datasets and their counts matrices were merged. A UMAP plot of the intersection is shown. The stacked histogram shows the relative contributions of each sample to each cluster. Although the clusters were well mixed, they had very diffuse marker gene expression suggesting key biological drivers of variation were obscured by the analysis. h) For the clusters with at least 20% contribution from both primary and organoid cells, differential expression was performed across all of these clusters jointly using a two-sided Wilcoxon rank sum test. The full differential expression is presented in STable 5, but genes upregulated in organoid cells were examined with Enrichr pathway analysis, and a summary of the top Gene Ontology terms are presented (organoid: n=20,000 cells from 37 organoids across 4 independent experiments; primary: n=20,000 cells from 5 individuals across 5 independent experiments). i) MetaNeighbor was performed using unsupervised analysis to compare the clusters from primary and organoid samples. MetaNeighbor uses cell-cell similarity scores based upon neighbor voting and AUROC calculations to quantify the similarities between cells. These pairwise values were used as an input to hierarchical clustering, and almost entirely segregated primary clusters from organoid clusters. Box and whiskers plot shows quantification of the similarities within organoid and primary datasets versus the comparison of the two showed the primary alone comparisons were significantly higher (organoid to organoid: ***p= 0.00078; primary to organoid: ***p= 0.00036, two-sided Welch’s t-test) (organoid: n=20,000 cells from 37 organoids across 4 independent experiments; primary: n=20,000 cells from 5 individuals across 5 independent experiments). The bars show range of subtype correlation with middle line indicating the mean and error bars the maximum and minimum. These results further validate our observations that there are important distinctions between the organoid and primary subtypes j) The gene score for each of the 4 integration methods is presented, and all are significantly lower than primary clustering alone (organoid subtype: ****p=5.3e−38; CCA v3 Projected: ****p5.5e−94; CCA v3 Integrated: ****p=2.8e−24; scAlign: ****p=2.1e−23; LIGER: ****p=2.9e−94, two-sided Welch’s t-test). The one method that substantially integrated the samples (LIGER) had the lowest gene score. Box and whisker plot shows average mean score and error bars are max and minimum (n=242,349 cells from 37 organoids across 4 independent experiments). The differentially expressed genes that were upregulated in primary samples from all 4 analyses were intersected. A significant number of these genes were found in all 4 datasets, and these genes included examples that we identified from other methods in this study, including PTPRZ1, MEF2C and SATB2, validating the accuracy of our analytical methods and our main findings.

