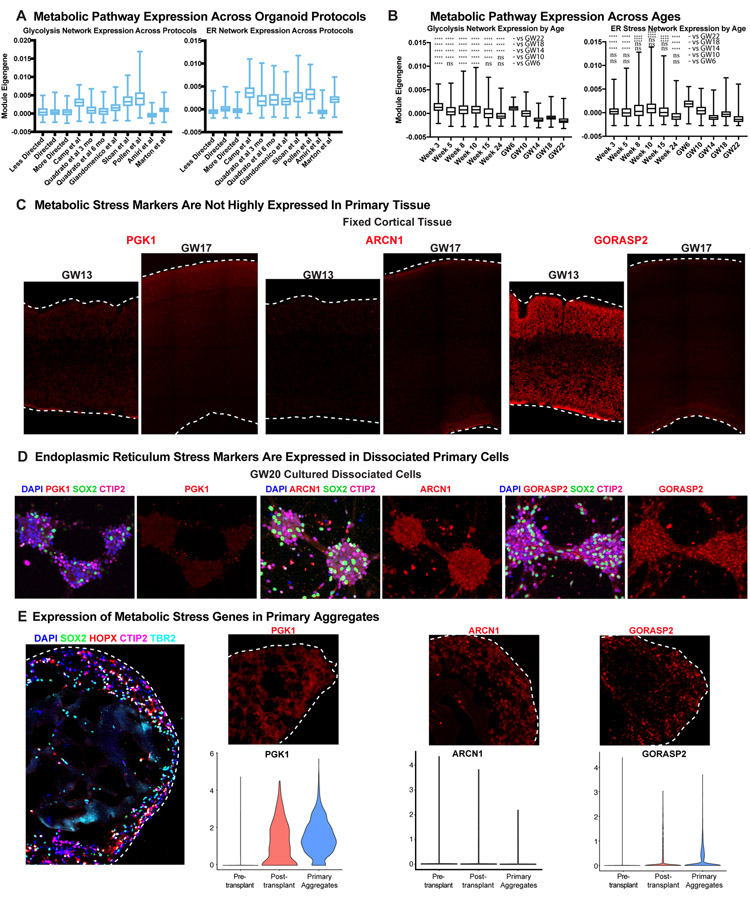
Extended Data Figure 13. Glycolysis and ER Stress Across Experimental Conditions.
a) Metabolic stress network module eigengene expression across all cells is shown in box and whisker plots (min to max, bar at average, error bars of standard deviation) across 11 datasets generated either in this manuscript or from publicly available datasets. Data is shown for expressed genes from KEGG pathway glycolysis and ER stress networks (This study: n=242,349 cells from 37 organoids across 4 independent experiments; published datasets as annotated). b) The same box and whisker plots (min to max, bar at average, error bars of standard deviation) are shown for organoid (n=week 3: 38,417 cells, week 5: 26,787 cells, week 8: 11,023 cells, week 10: 50,550 cells, week 15: 2,722 cells, week 24: 4,506 cells from 4 independent experiments) and all primary ages (n= GW6: 5,970 cells, GW10: 7,194 cells, GW14: 14,435 cells, GW18: 78,157 cells, GW22: 83,653 cells from 5 independent experiments). ER stress and glycolysis networks decrease over time in primary samples but decrease less in organoids and are significantly higher in most organoid stages than primary samples. Significance was calculated for each organoid sample with respect to each primary sample, and a one-sided Welch’s t-test was performed (to evaluate if organoid was higher than primary). All comparisons were either not significant (ns) or significant with ****p < 0.0001. c) Cellular stress genes are expressed at low levels during human cortical development. GW13 and 17 samples were stained for the glycolysis gene, PGK1, and showed little expression at either age. The ER stress gene, ARCN1, had little expression at either age, however there was modest expression of the ER stress gene, GORASP2, at GW13 that decreased by later neurogenesis. Staining validation studies were performed independently four times. d) Dissociated primary cells were cultured for one week. Across five independent studies , there was no detectable expression of the glycolysis gene, PGK1, however the ER stress genes, ARCN1 and GORASP2, significantly increased. e) Immunostaining of primary aggregates (n=5 biologically independent samples), which express markers of oRG cells (HOPX and SOX2), IPCs (TBR2) and neurons (CTIP2). Aggregates also had increased cellular stress indicated by PGK1, ARCN1 and GORASP2 staining. Violin plots show expression level and data distribution for each maker in primary cells, primary cells after organoid transplantation and primary cells after being aggregated together. The expression of PGK1 and GORASP2 are increased in post-transplanted primary cells from the organoid as well as in primary cell aggregates. Cell types and physical distribution in the primary aggregate are shown, scale bar = 50 mM, representative image shown (n = 3 replicates).

