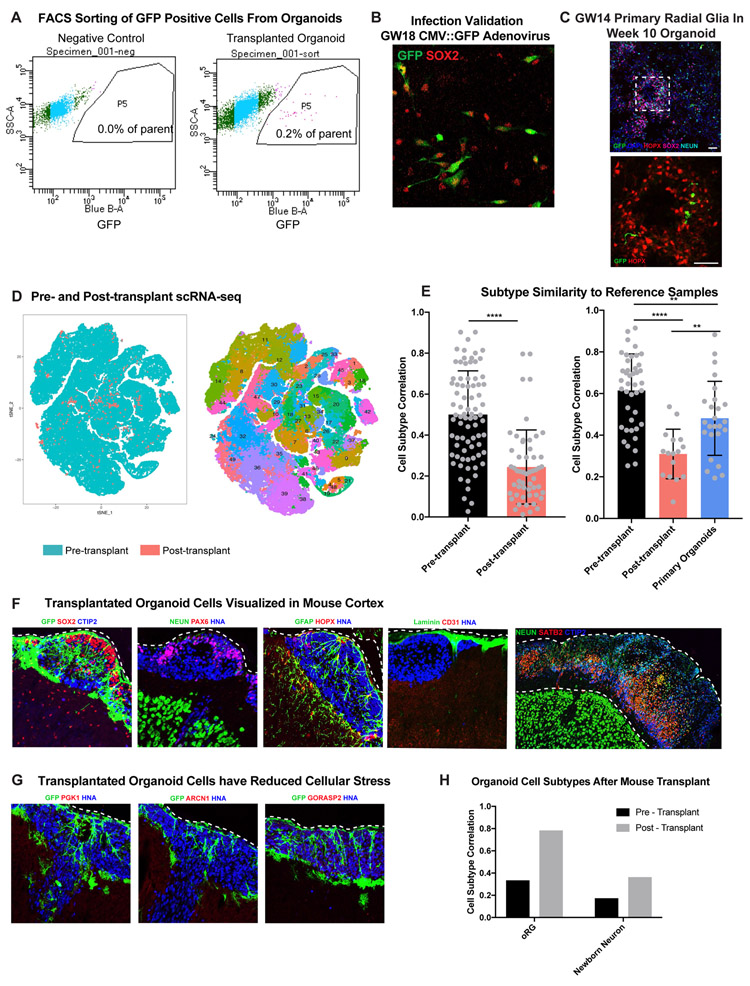
Extended Data Figure 14. Organoid Transplantation at Multiple Timepoints.
a) Fluorescence associated cell sorting (FACS) plots showing dummy infection (left) and transplanted organoids (right) in terms of the their GFP signal [x-axis] vs sidesscatter [y-axis]. Cells in gated region were collected (% of parent written on plot) and sequenced for transplantations 2.5 weeks after incubating in the organoid, representative plot shown on right, n=5. b) Immunohistochemical validation of cells infected with GFP virus were all SOX2 labeled progenitor in cells dissociated from primary cortical tissue GW14-20. Scale bar = 50 mM, representative image shown (n = 5 replicates). c) An additional example of primary cell integration into organoids after transplant, where the primary cells integrate into organoid rosettes (n=7 primary samples into 21 organoids across 2 independent studies). d) tSNE of pre- and post-transplant primary cells, as well as the cluster designations. Many cell types represented in pre-transplanted cells are not present in the post-transplant population. e) Subtype similarity correlation between pre-transplant, post-transplant, and primary aggregate samples. Includes plot (bar is average subtype correlation, error bars are standard error) as a replicate to the experiment in Figure 5B, validating that at older organoid ages (week 12) the post-transplanted cells are still significantly impaired in their subtype specification (****p = 1.46e−11 n = 2 primary biologically independent samples into 2 organoids in addition to n = 5 biologically independent samples into 10 organoids in Figure 5, two-sided Welch’s t-test). Primary aggregates are significantly impaired in their subtype specification (**p = 0.0016), but are significantly better than post-transplanted primary cells (**p= 0.0037). This may be related to non-neural populations in the aggregates. f) Transplanted organoid cells were visualized in the mouse cortex after 2 and 5 weeks post-transplant (n=13 independent mice transplanted with 14 organoids derived from 2 iPSC lines across 2 independent experiments). Human cells were visualized by GFP and human nuclear antigen (HNA) expression. Organoid-derived cells expressed markers of progenitors (SOX2 and PAX6), neurons (CTIP2, SATB2, NEUN) and astrocytes (GFAP, HOPX). Mouse-derived vascular cells (Laminin & CD31) innervate the organoid transplant. g) After 2 weeks post-transplantation, organoid cells have reduced expression of the glycolysis gene, PGK1, and ER stress genes, ARCN1 and GORASP2 (n=6 transplanted mice stained with each marker independently from 2 iPSC lines across 2 independent experiments). h) Subtype correlation analysis of pre- and post- transplanted organoid cells shows an increase in oRG subtype identity (similarity to primary cluster 26) and in newborn neurons (similarity to primary cluster 22).

