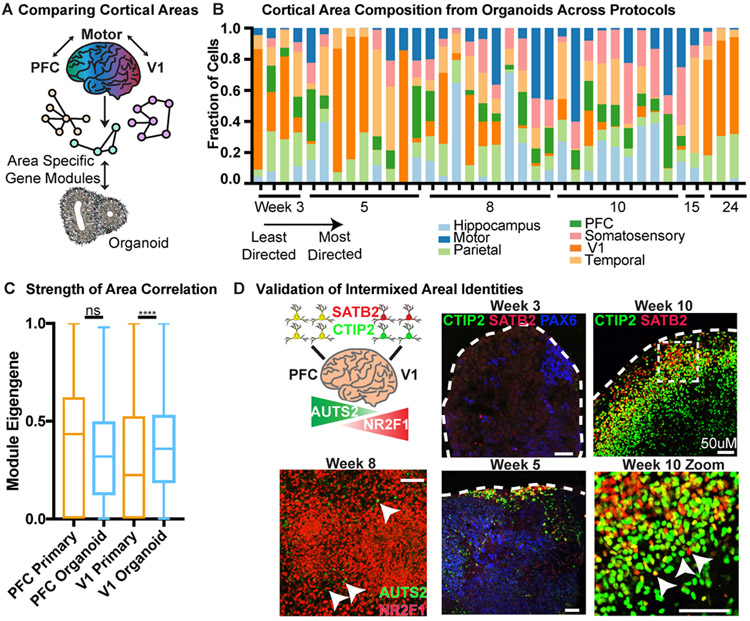
Figure 4. Analysis of Areal Identity in Organoid Excitatory Neurons.
a) Each of seven cortical areas was used to generate a unique area gene signature by comparing expression to the other six areas. The unique signatures were considered networks, and module eigengenes across area networks were calculated for each primary and organoid cell. The area with the highest normalized eigengene (normalized to the highest score within each area for equal comparison) was designated as the areal identity of that cell. b) Areal identity was assigned for each cell within an organoid and the areal composition is shown for the 37 organoids in our dataset. Organoid samples are listed from earliest to latest stage collected (weeks 3-24). Within a timepoint, the organoid protocol used is ordered from least to most directed differentiation; each timepoint is comprised of multiple PSC lines. Every organoid has heterogeneous areal expression. c) The average module eigengene score for each primary (orange) and organoid (blue) cell designated (primary) or assigned (organoid) PFC or V1 identity (primary: n=5 independent samples across 5 experiments; organoid: n=37 organoids across 4 independent experiments). The average value for PFC was not significantly different between organoid and primary, while the V1 organoid cells had higher correlation to the V1 signature than primary cells, indicating areal identity in the organoid strongly resembles normal development (mean with standard deviation shown, two-sided Welch’s t-test, p= 0). d) Validation of intermixing of areal identities in organoid samples differentiated using the ‘least directed’ differentiation protocol. In the PFC, BCL11B (CTIP2) and SATB2 co-localize in the same cell, whereas in V1 cells they are mutually exclusive. Both patterns are in close proximity in the organoid. AUTS2 is a rostrally expressed transcription factor while NR2F1 is a caudally expressed factor, but are adjacent in the organoid. Scale bar = 50 uM, representative image shown (n = 3 replicates each).

