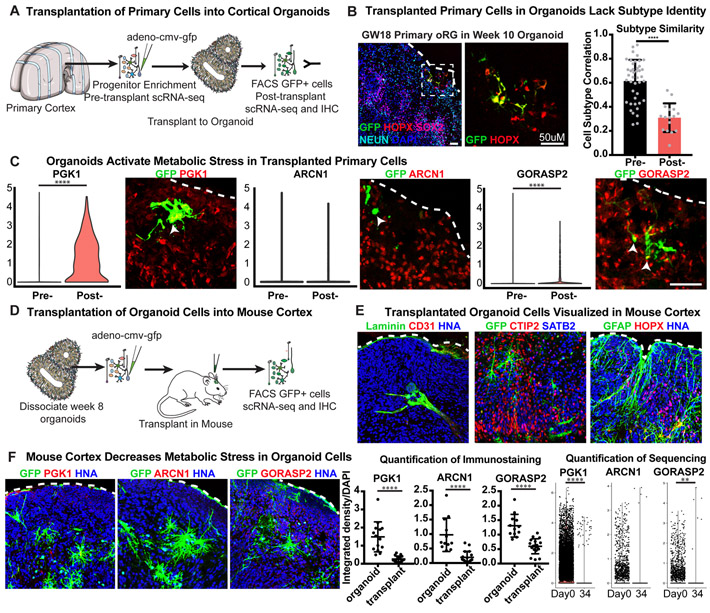
Figure 5. Influence of Culture on Metabolic Stress and Cell Type.
a) Primary samples were progenitor-enriched, GFP-labeled and transplanted into organoids. After 2.5 weeks, GFP+ cells were isolated via FACS and processed for scRNA-seq. b) Primary GFP+ cells integrate into organoids differentiated using the ‘least directed’ protocol. Scale bar = 50 uM. Pre-transplantation cells have similar profiles and cellular subtypes as primary data. After transplantation, there is a decrease in subtype correlation (n=7 biologically independent samples across 2 independent experiments). Mean subtype correlation indicated on graph, error bars show standard deviation (p= 2.8e−9, two-sided Welch’s t-test). c) After transplant, primary cells increase expression of stress genes, PGK1 (****p= 1.76e−87, two-sided student’s t-test) and GORASP2 (arrow; ****p= 9.60e−63 two-sided student’s t-test) as indicated by width of colored domain in each respective violin plot (n=7 samples across 2 experiments). Scale bar = 50 uM. d) Organoids were dissociated, GFP labeled, and injected into the cortex of P4 mice. After 2-5 weeks, mouse brains were harvested for scRNA-seq and immunostaining. e) Human cells are visualized by GFP and human nuclear antigen expression (n=13 mice transplanted with 14 organoids derived from 2 iPSC lines across 2 independent experiments). Organoid cells express markers of progenitors (HOPX), neurons (CTIP2, SATB2) and astrocytes (GFAP). Mouse vascular cells (Laminin & CD31) innervate the transplant. f) Post-transplant, organoid cells have reduced expression of stress genes. Scatter plots show decreased staining intensity in transplanted organoids (error bars: standard deviation) of PGK1 (****p= 9.64E-07), ARCN1 (****p=1.28E-05) and GORASP2 (****p=1.88E-06; n=19 sections from 6 transplanted mice across 2 experiments, each marker stained independently; all comparisons used the two-sided student’s t-test). Violin plots show a decrease in PGK1 (****p= 2.16e−17) and GORSASP2 (**p= 0.0019) expression in organoid cells post-transplant from single cell analysis (n= 1980 cells from 7 transplanted mice across 2 experiments, all groups were evaluated using the two-sided Welch’s t-test).

