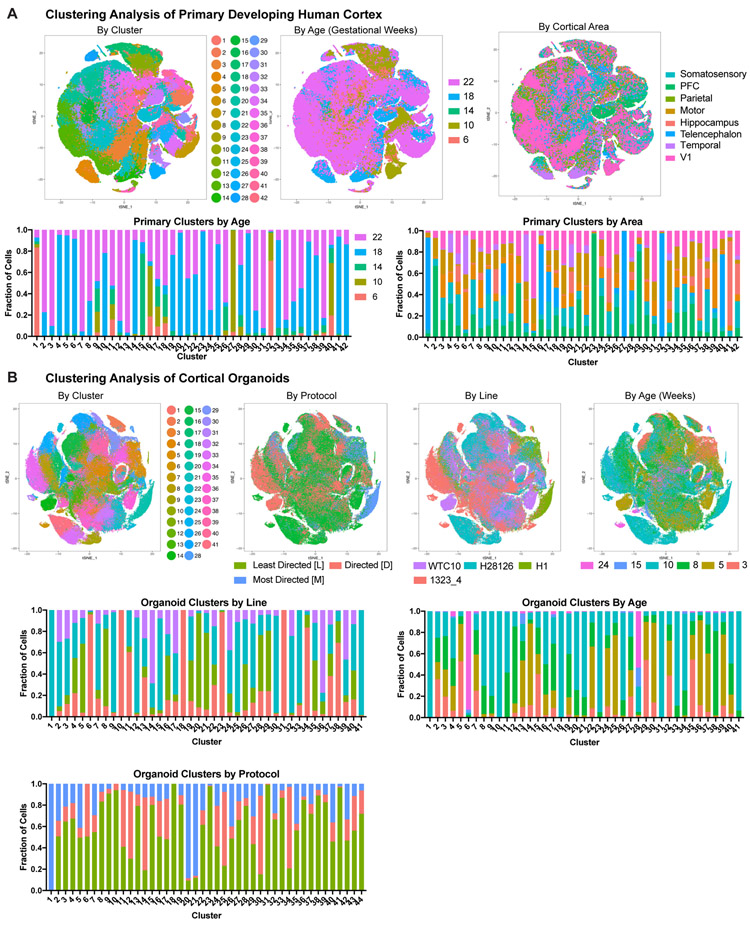
Extended Data Figure 4. Single-cell Comparison of Cell Types Across Samples.
a) tSNE plots depicting the single-cell analysis of primary cortical cells as colored by cluster, age of sample, and cortical area. Stacked histograms showing composition of each cluster for these metadata properties are also included. b) tSNE plots depicting the single-cell analysis of cortical organoid cells as colored by cluster, protocol, pluripotent stem cell line (iPSC or hESC), and age of sample. Stacked histograms showing composition of each cluster for these metadata properties are also included.

