
Fig. 3.
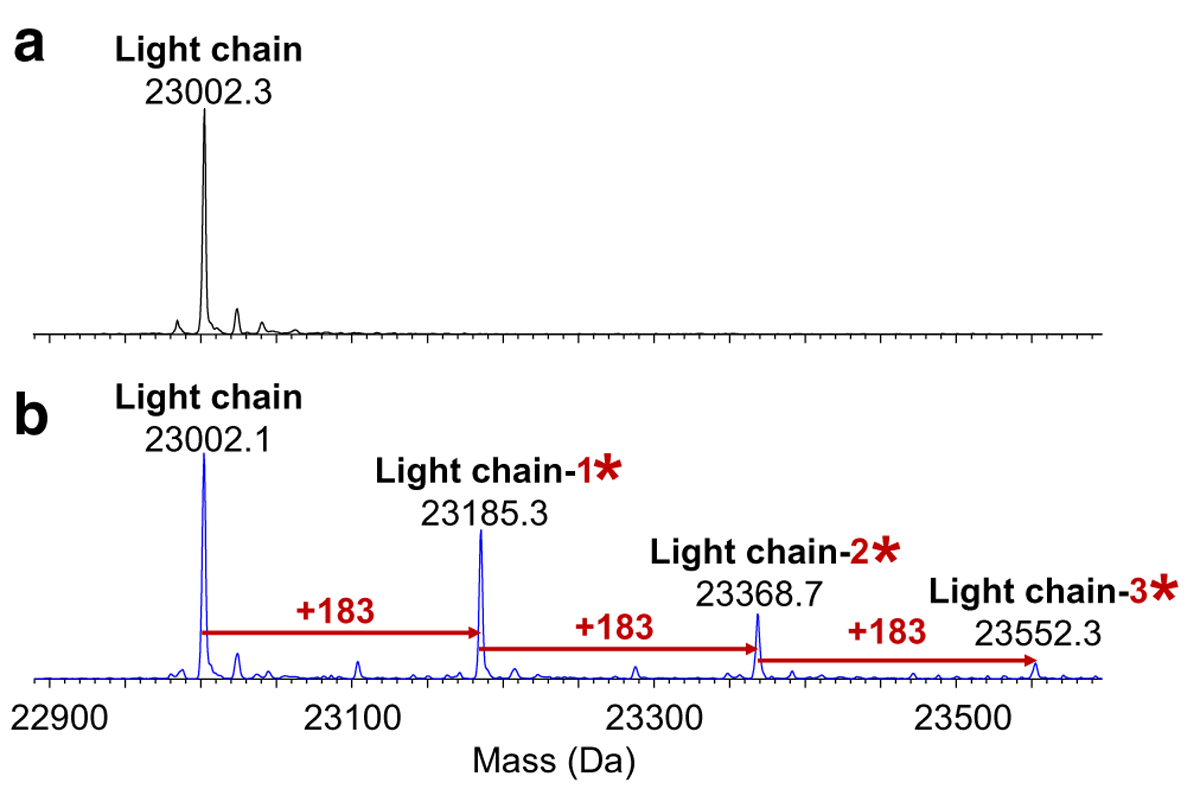
Deconvoluted mass spectra of the light chain subunit at 7.2 min for (a) the negative control and (b) day-7 positive control samples (*AEBSF; y-axis is relative abundance, normalized to the highest peak in each spectrum)
Official websites use .gov
A
.gov website belongs to an official
government organization in the United States.
Secure .gov websites use HTTPS
A lock (
) or https:// means you've safely
connected to the .gov website. Share sensitive
information only on official, secure websites.
Deconvoluted mass spectra of the light chain subunit at 7.2 min for (a) the negative control and (b) day-7 positive control samples (*AEBSF; y-axis is relative abundance, normalized to the highest peak in each spectrum)