
Figure 2.
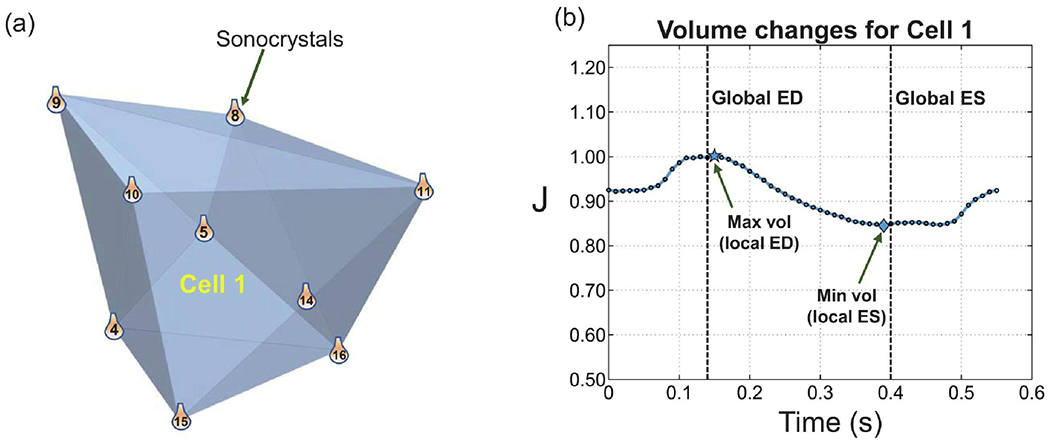
A representative convex hull constructed by nine sonocrystals and labeled as Cell 1. (b) Variation of the volume of Cell 1 within one cardiac cycle. The local and global ED and ES time points are denoted. The local ED and ES identify the time points at which the maximum and minimum volumes of Cell 1 occur, respectively.