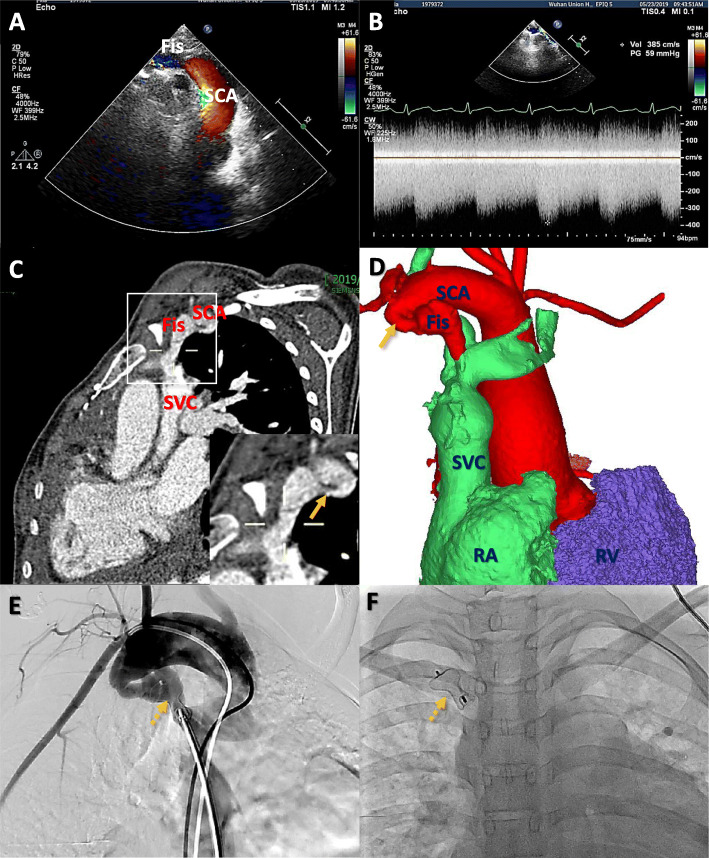
Fig. 1.
a Transthoracic echocardiography shows the arteriovenous fistula (Fis) between the right subclavian artery (SCA) and the superior vena cava (SVC); b Continuous-wave Color Doppler interrogation of the fistula shows high velocity flow signals moving from the SCA into the SVC throughout the cardiac cycle (stenosis site: velocity 385 cm/s, pressure gradient 59 mmHg); c, d Computed tomographic angiography and three-dimensional reconstruction show the fistula and obvious stenosis site (arrow); e,f The fistula is successfully closed using a 10/12 mm Amplatzer Ductal Occluder (asterisk) by the guidance of angiography (dotted arrow); RA — right atrium; RV — right ventricle

