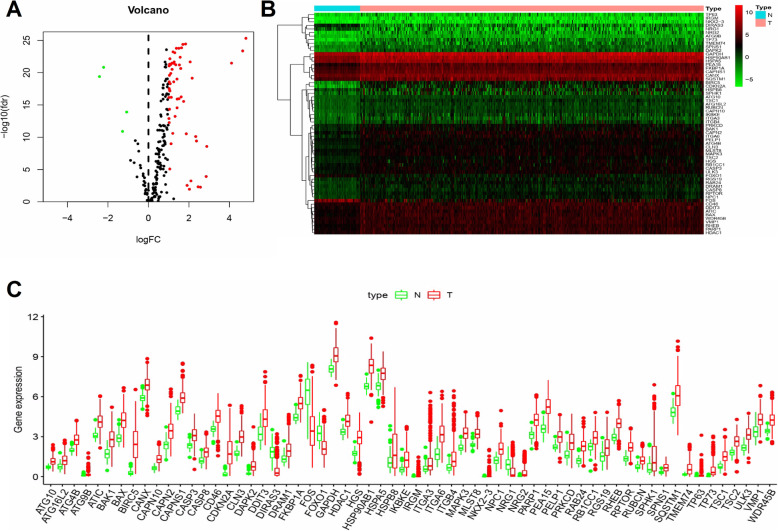
Fig. 1.
Differentially expressed autophagy-related genes (ARGs) between hepatocellular carcinoma (HCC) and normal samples. a A total of 222 HCC-related ARGs are represented in the volcano plot. Red points indicate upregulated ARGs, while green points represent downregulated ARGs in HCC, compared with normal tissue samples. b Hierarchical clustering of 62 differentially expressed ARGs in HCC, compared with normal tissue samples. Intensities of red and green colors indicate higher or lower gene expression, respectively. c The expression profile of ARGs in HCC and corresponding non-tumor samples. Red boxplots represent gene expression distribution in tumor tissue samples, while green boxplots represent gene expression distribution in normal tissue samples. These plots were created using R software v3.6.1

