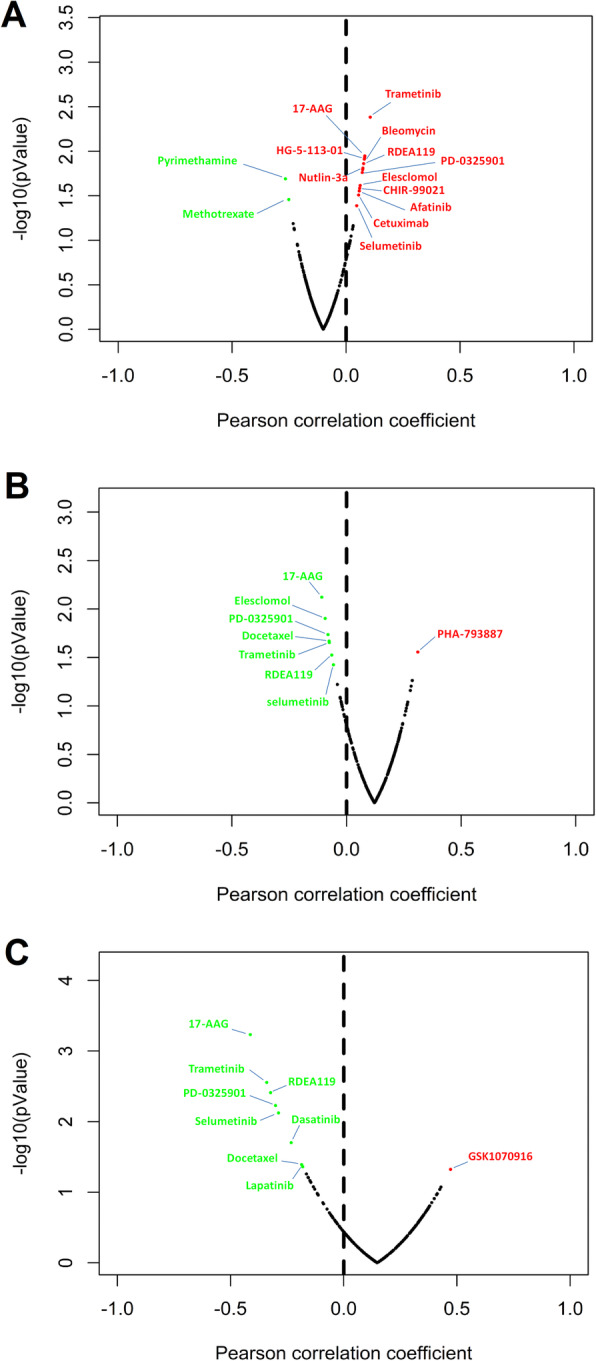
Fig. 8.

Relationship between risk-associated ARGs and drug resistance. The plots represent the correlation of (a) HDAC1, (b) RHEB and (c) SQSTM1 expression with the IC50 of several specific drugs in the liver cell lines. Red dots represent positive correlation between IC50 of the drug and the expression level of risk-associated ARGs, which indicates increased drug resistance with higher ARG expression (p < 0.05). Conversely, green dots represent negatively correlated drugs’ IC50 with the expression of risk-associated ARGs, indicating increased drug sensitivity with higher ARG expression (p < 0.05). These plots were created using R software v3.6.1
