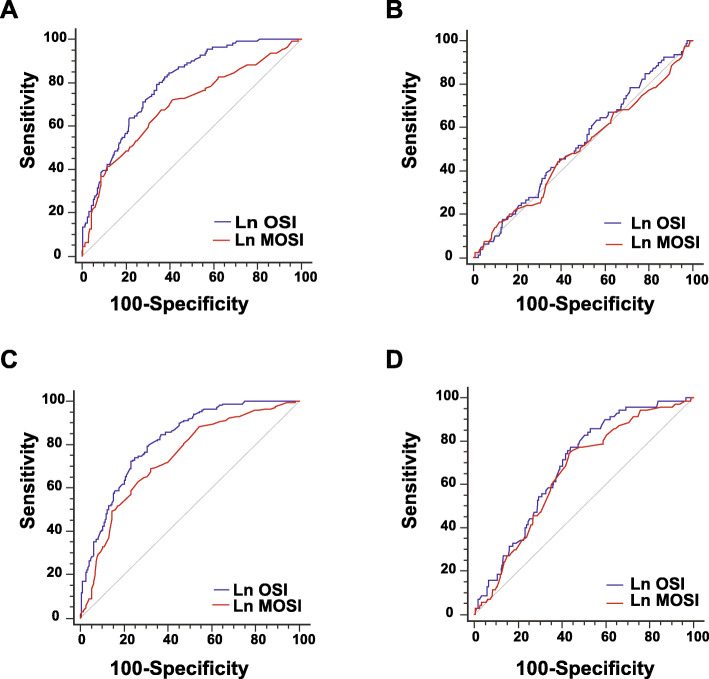
Fig. 2.
The predictability of ovarian sensitivity index (OSI) and modified ovarian sensitivity index (MOSI) for in vitro fertilization outcomes. Receiver operating characteristic curves were constructed to determine if OSI (blue line) or the MOSI (red line) can predict a ≥ 4 high-quality embryos, b a rate ≥ 35% for the number of high-quality embryos/the number of ova captured, c ≥ 2 blastocyst, and d a rate ≥ 35% for the number of blastocysts/the number of ova captured. Comparison of Area Under Curve between predictors was performed using SPSS v26

