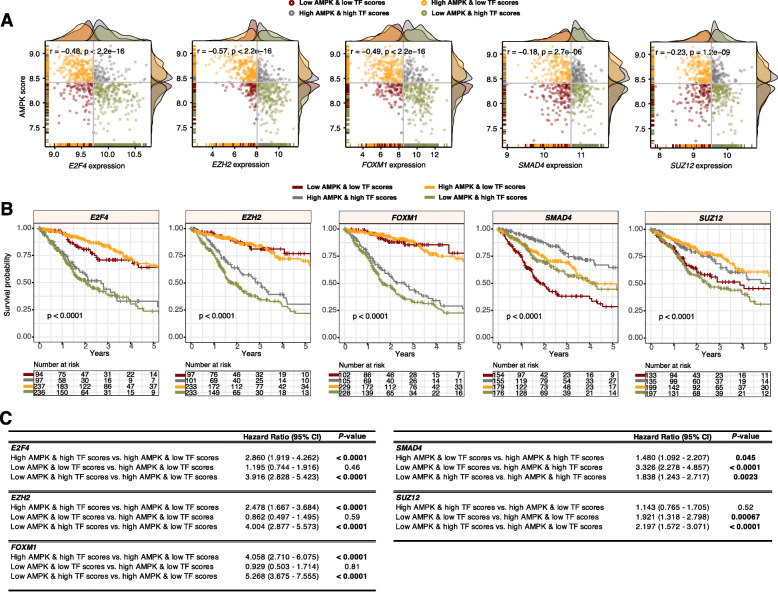
Fig. 6.
Prognostic relevance of candidate TFs and the 24-AMPK-gene set in glioma. a Scatter plots illustrate significant negative correlations between AMPK scores and TF expression levels in glioma. Patients are separated and color-coded into four categories based on median AMPK and TF scores. Density plots appended to the y- and x-axes demonstrate the distribution of AMPK and TF scores. b Log-rank tests are performed on the four patient groups to demonstrate the utility of combined AMPK and TF scores in patient stratification. c Univariate Cox regression analyses are performed to compare patient groups where significant P values are highlighted in bold. CI: confidence interval

