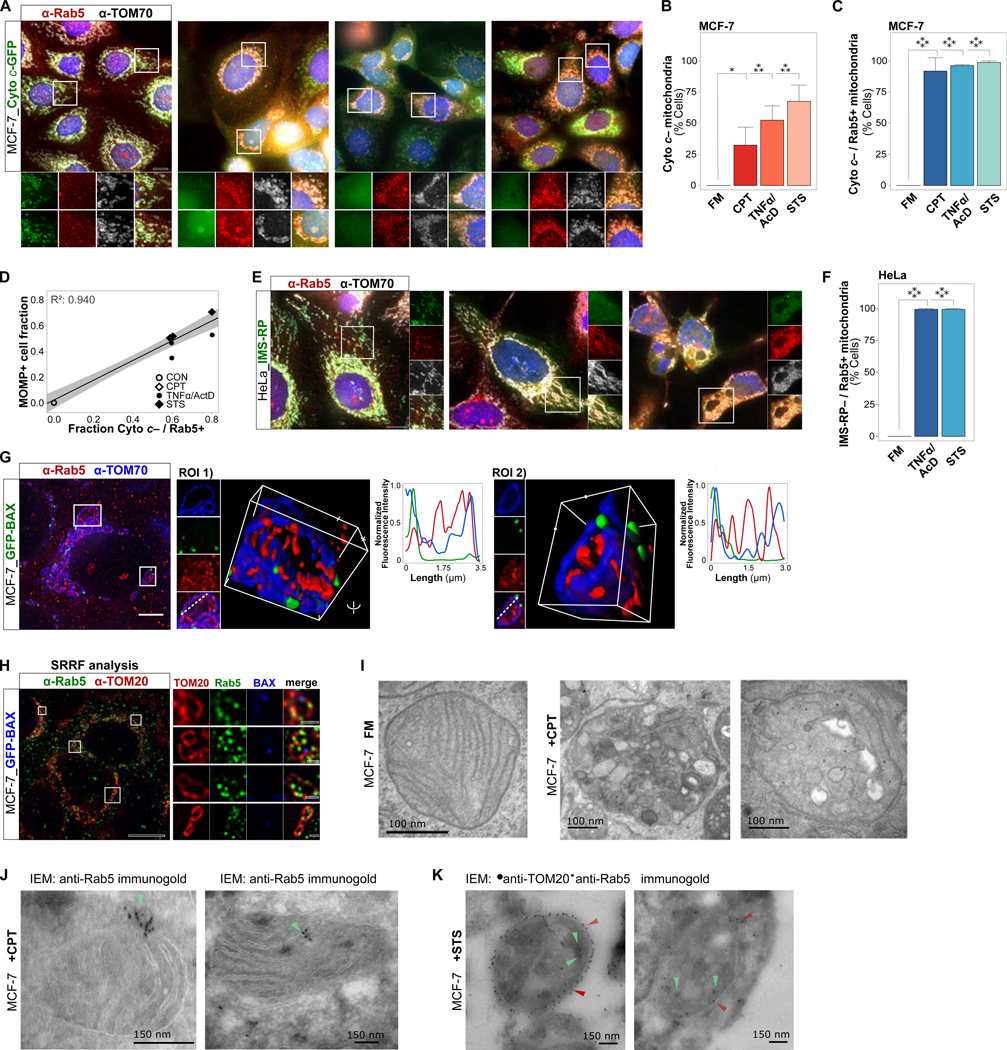
Figure 1. Various Apoptotic Stimuli Trigger Targeting of Rab5+ ELs to Mitochondria.

(A) MCF-7_Cyto c-GFP cells, in normal growth medium (full medium, FM) or treated with STS (1 μM) for 4 hrs, TNF α/AcD (50 ng/mL / 1 μg/mL) for 6 hrs, or CPT (20 μM) for 24 hrs. IF of Rab5 and TOM70. Scale bars, 10 μm.
(B) Cells from (A) were scored for mitochondria with released cytochrome c (Cyto c–).
(C) Cells from (A) were scored for Cyto c– mitochondria targeted by Rab5 (Cyto c– / Rab5+).
(D) Correlation between cells positive for MOMP (Cyto c–) and Cyto c– / Rab5+ mitochondria. Symbols represent mean of independent experiments.
(E) HeLa_IMS-RP cells, in FM or treated with STS+zVAD for 4 hrs, or TNFα/AcD+zVAD for 6 hrs. IF of Rab5 and TOM20. Scale bars, 10 μm.
(F) Cells from (E) were scored for mitochondria with released IMS-RP targeted by Rab5 (IMS-RP– / Rab5+).
(G) MCF-7_GFP-BAX cells, treated with TNFα/AcD for 6 hrs, IF of Rab5 and TOM70. 3D reconstruction, single and merged channels of ROIs, and line profile of dotted lines from ROIs. Scale bars, 10 μm. See also Figure S1, and Videos S1 and S2.
(H) SRRF imaging of MCF-7_GFP-BAX cells, treated with TNFα/AcD for 6 hrs, IF of Rab5 and TOM20. Inset scale bar 1 μm.
(I) Electron micrographs of MCF-7 cells in FM or treated with CPT for 24 hrs. Zoom images of single mitochondria. Scale bars, 100 nm. See also Figure S1F.
(J) Immunoelectron microscopy of MCF-7 cells treated with CPT for 24 hrs, immunogold-labeled for Rab5 (green arrowheads). Left, mitochondrion with adjacent Rab5+ vesicle. Right, mitochondrion with internalized Rab5+ vesicle. Scale bars, 150 nm. See also Figures S1G and S1H.
(K) Immunoelectron microscopy of MCF-7 cells treated with STS for 4 hrs, immunogold-labeled for TOM20 (red arrowheads) and Rab5 (green arrowheads).
Graphs, mean of n = 3 experiments. Error bars, standard deviation. ≥ 300 cells per condition. *p < 0.05, ***p ≤ 0.001, ****p ≤ 0.0001
