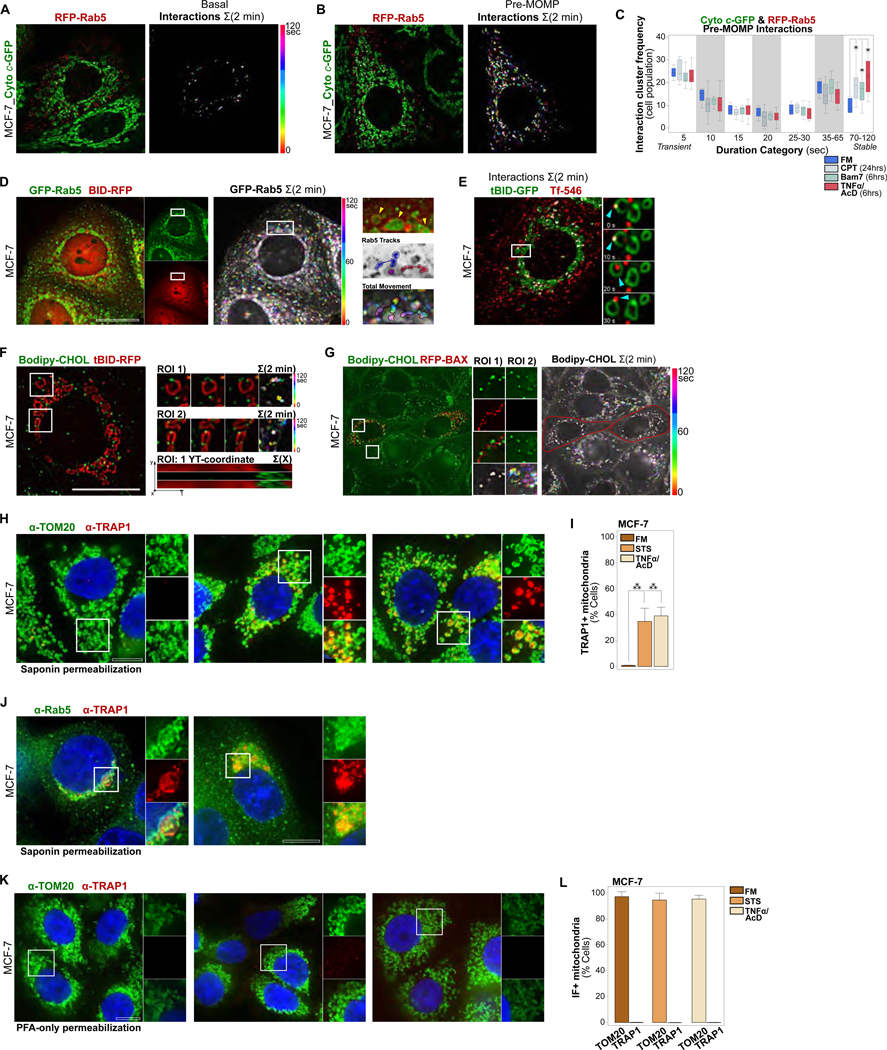
Figure 2. ELs Targeting Apoptotic Mitochondria are Dynamic and Biochemically Active.

(A) MCF-7_Cyto c-GFP_RFP-Rab5 cells, live imaged every 5 sec over 2 min under FM conditions. Left, merged channel single time-point images with EL-mitochondrial interactions overlaid in white. Right, color-coded EL-mitochondrial interactions, projected over 2 min.
(B) MCF-7_Cyto c-GFP_RFP-Rab5 cells, live imaged every 5 sec over 2 min at 6 hrs of TNFα/AcD treatment. Analyzed as in (A).
(C) Cluster analysis of transient to stable interactions from individual pre-MOMP (Cyto c-GFP+) cells in a population, imaged as in (A), under FM, TNFα/AcD (6 hrs), BAM7 (6 hrs) or CPT (24 hrs). *p ≤ 0.05. 6–19 cells per condition.
(D) MCF-7 cells co-expressing GFP-Rab5 and BID-RFP, treated with TNFα/AcD for 5 hrs and then live imaged every 5 sec for 2 min. Left, single channel images. Middle, GFP-Rab5 color-coded time-steps projected over 2 min. Right, yellow arrows in ROI zoom mark three mitochondria. ROI with tracked vesicle movements (blue and red shades) to show diverse associations of individual Rab5+ ELs with mitochondria. GFP-Rab5+ vesicle movement boundaries are shown in color-coded time-step ROI.
(E) MCF-7 cell expressing tBID-GFP for 18 hrs, loaded with Transferrin-AF546 and imaged live every 5 sec over 2 min. Time-sum merged channel image with interactions overlaid in white. Single time-point ROIs, cyan arrowheads track transferrin-loaded EL. See also Video S3.
(F) MCF-7 cell expressing tBID-RFP for 18 hrs, loaded with Bodipy-CHOL in the presence of u18666a, imaged live every 5 sec over 2 min. Overview image and ROI time-series shown as color-coded time-step 2 min sum. Bottom right, YT-coordinate projection of mitochondrion in ROI 1. See also Video S4.
(G) MCF-7 cells co-expressing tBID-BFP (not shown) and RFP-BAX for 18 hrs, loaded with Bodipy-CHOL in the presence of u18666a, imaged live every 5 sec over 2 min. Left, merged channels of single time point. ROI of channels, and color-coded time-step 2 min sum. Right, overview color-coded time-step 2 min sum of Bodipy-CHOL movement.
(H) MCF-7 cells in FM, or treated with STS (5 hrs) or TNFα/AcD (6 hrs). IF of saponin-permeabilized cells for TOM20 and TRAP1.
(I) Quantifications of cells treated as in (H) scored for TRAP1 saponin-IF+ mitochondria. Graphs, mean of n = 3 experiments. Error bars, standard deviation. > 275 cells per condition. ***p ≥ 0.001.
(J) MCF-7 cells treated with STS (5 hrs) or TNFα/AcD (6 hrs). IF of saponin-permeabilized cells for inner-mitochondrial TRAP1 and Rab5.
(K) MCF-7 cells in FM, or treated with STS (5 hrs) or TNFα/AcD (6 hrs). IF of PFA-permeabilized cells for TOM20 and TRAP1.
(L) Quantifications of cells as in (H) scored for TOM20 and TRAP1 PFA-IF+ mitochondria. Graphs, mean of n = 2 experiments. Error bars, standard deviation. > 90 cells per condition. Scale bars, 10 μm.
