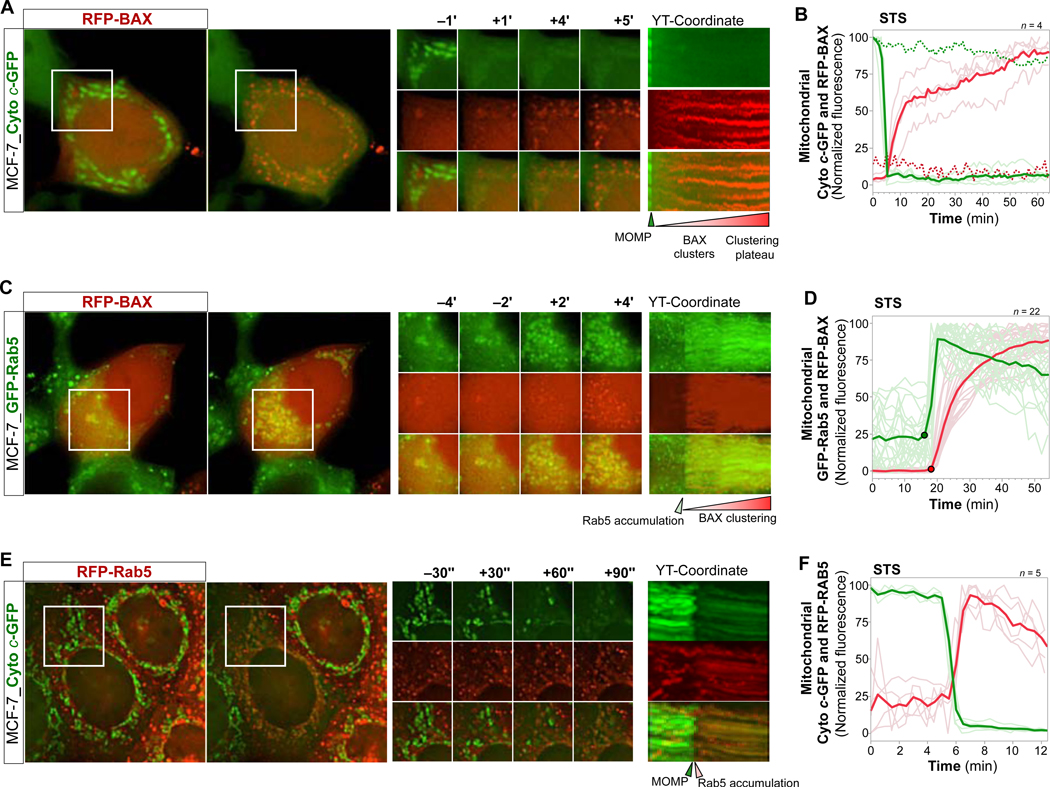
Figure 3. ELs Accumulate within Apoptotic Mitochondria in a Rapid Manner, Coinciding with Mitochondrial BAX Clustering and Cytochrome c Release.

(A) MCF-7_Cyto c-GFP cells, transfected with RFP-BAX, live imaged every 1 min over 40+ min starting at 4 hrs of STS treatment. Overview images, time-series ROI, YT-coordinate of ROI projected over X. See also Video S5.
(B) Graph of mitochondrial Cyto c-GFP (green traces) and RFP-BAX (red traces) intensities of 4 cells treated and imaged as in (A). Bold traces, mean. Pale traces, individual cells. Dotted traces, reference intensities over time.
(C) MCF-7_GFP-Rab5_RFP-BAX cells, live imaged every 2 min over 40+ min at 4 hrs STS. Images displayed as in (A). See also Video S6.
(D) Graph of mitochondrial GFP-Rab5 (green) and RFP-BAX (red) intensities of 22 cells treated and imaged as in (C). Graph displayed as in (B).
(E) MCF-7_Cyto c-GFP_RFP-Rab5 cells, live imaged every 30 sec over 10+ min at 6 hrs TNFα/AcD. Images displayed as in (A). See also Video S7.
(F) Graph of mitochondrial Cyto c-GFP (green) and Rab5-RFP (red) intensities of 5 cells treated with STS for 4 hrs, and imaged as in (C). Graph displayed as in (B).
Scale bars, 10 μm.
