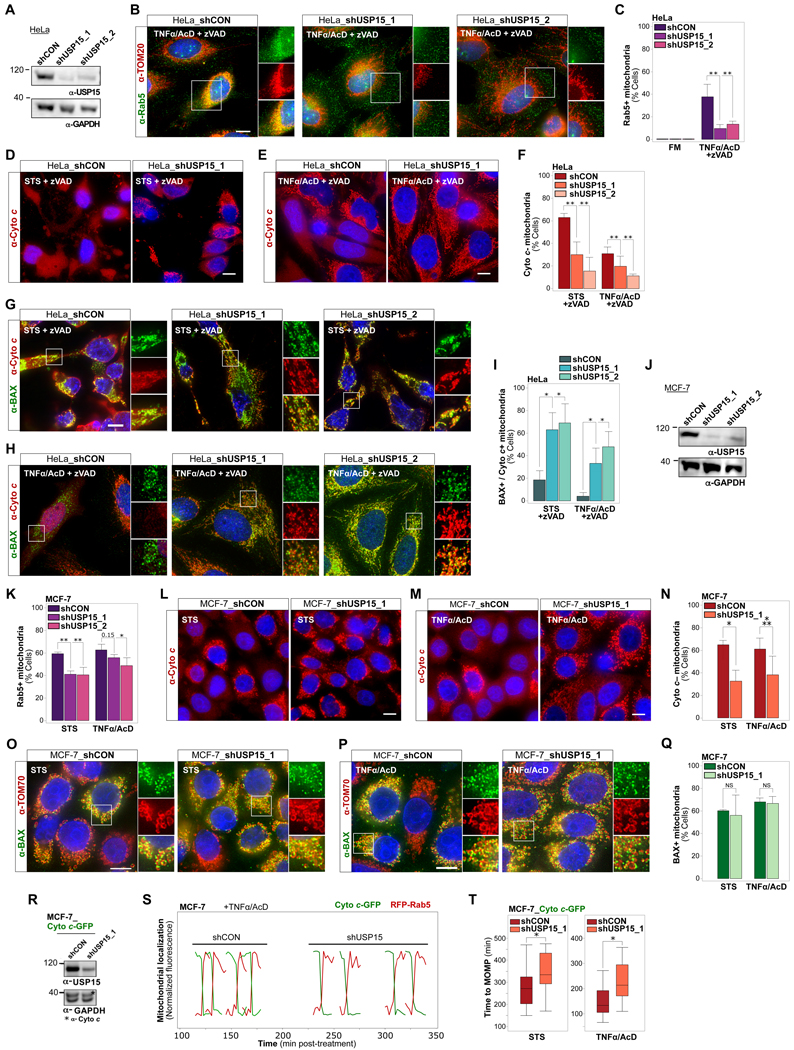
Figure 5. Reducing EL Mobility Through KD of USP15 Impairs BAX-mediated Cytochrome c Release.
(A) Immunoblot for USP15 protein levels in HeLa_shCON, HeLa_shUSP15_1 or HeLa_shUSP15_2 cells. GAPDH, loading control.
(B) Cells as in (A) treated with TNFα/AcD +zVAD for 6 hrs. IF of Rab5 and TOM20.
(C) Quantification of cells as in (B), in FM or treated with TNFα/AcD +zVAD for 6 hrs, scored for mitochondrial accumulation of endogenous Rab5. ≥ 200 cells counted per condition.
(D) HeLa_shCON or HeLa_shUSP15_1 cells treated with STS +zVAD for 4 hrs. IF of cytochrome c.
(E) Cells as in (D), treated with TNFα/AcD + zVAD for 6 hrs. IF of cytochrome c.
(F) Quantification of HeLa_shCON, HeLa_shUSP15_1 or HeLa_shUSP15_2 cells treated with STS +zVAD for 4 hrs or TNFα/AcD +zVAD for 6 hrs. IF of BAX and cytochrome c. Cells scored for Cyto c– mitochondria. > 200 cells per condition.
(G) HeLa_shCON, HeLa_shUSP15_1 or HeLa_shUSP15_2 cells treated with STS +zVAD for 4 hrs. IF of BAX and cytochrome c.
(H) HeLa_shCON, HeLa_shUSP15_1 or HeLa_shUSP15_2 cells treated with TNFα/AcD + zVAD for 6 hrs. IF of BAX and cytochrome c.
(I) Quantification of cells as in (F) scored for BAX+ / Cyto c+ mitochondria. > 500 cells per condition.
(J) Immunoblot for USP15 protein levels in MCF-7_shCON, MCF-7_shUSP15_1 or MCF-7_shUSP15_2 cells.
(K) MCF-7_shCON, MCF-7_shUSP15_1 or MCF-7_shUSP15_2 cells treated with STS for 4 hrs or TNFα/AcD for 6 hrs. IF of Rab5 and TOM20. Cells scored for mitochondrial accumulation of Rab5. ≥ 300 cells counted per condition.
(L) MCF-7_shCON or MCF-7_shUSP15_1 cells, treated with STS for 4 hrs. IF of cytochrome c.
(M) Cells as in (L), treated with TNFα/AcD for 6 hrs. IF of cytochrome c.
(N) Quantifications of cells as in (L, M), scored for Cyto c– mitochondria. > 500 cells per condition.
(O) MCF-7_shCON or MCF-7_shUSP15_1 cells treated with STS for 4 hrs. IF of BAX and TOM70.
(P) Cells as in (O) treated with TNFα/AcD for 6 hrs. IF of BAX and TOM70.
(Q) Quantifications of cells as in (O) and (P), scored for BAX+ mitochondria. > 500 cells per condition.
(R) Immunoblot of USP15 protein levels in MCF-7_Cyto c-GFP_shCON and MCF-7_Cyto c-GFP_shUSP15_1 cells.
(S) MCF-7_Cyto c-GFP_shCON and MCF-7_Cyto c-GFP_shUSP15_1 cells transfected with RFP-Rab5, treated with TNFα/AcD and live imaged in 1 min intervals for 360 min. Representative time-course analysis of mitochondrial loss of Cyto c-GFP (green traces) and mitochondrial accumulation of RFP-Rab5 (red traces), 4 cells per condition.
(T) MCF-7_Cyto c-GFP_shCON and MCF-7_Cyto c-GFP_shUSP15_1 cells, treated with STS or TNFα/AcD and live imaged in 1 min intervals for 10 hrs. From time lapse datasets (S), the onset of Cyto c release (time to MOMP) was calculated for single cells. Box plot, 26–49 time courses analyzed per condition. Error bars, standard deviation.
Nuclei stained with Hoechst. Scale bars, 10 μm. Graphs, mean of n = 3 experiments. Error bars, standard deviation. NS, not significant, *p ≤ 0.05, **p ≤ 0.01, ***p ≤ 0.001

