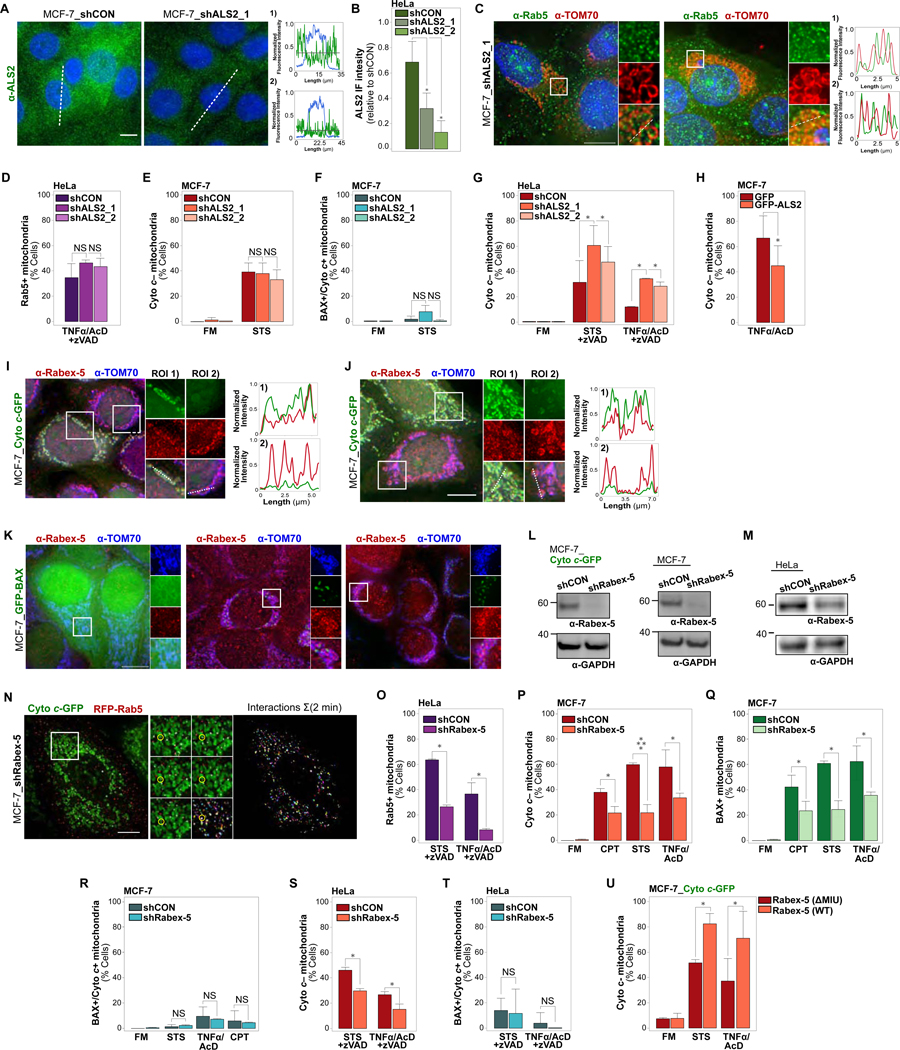
Figure 6. KD of Rab5 GEF Rabex-5, but not of ALS2, Reduces both BAX Accumulation at OMMs and Cytochrome c release.

(A) MCF-7_shCON or MCF-7_shALS2_1 cells, IF stained for ALS2. Representative images and intensity profiles over dotted lines. Black lines, mean intensity of ALS2 signal over dotted line.
(B) Quantification of HeLa_shCON, HeLa_shALS2_1 or HeLa_shALS2_2 cells, IF stained for ALS2. Graph, representative analysis of 20 cell mean cytoplasmic ALS2 IF intensities per condition, of n = 3 experiments. Error bars, standard deviation.
(C) MCF-7_shALS2_1 cells treated with STS (4 hrs) or TNFα/AcD (6 hrs). IF of Rab5 and TOM70.
(D) HeLa_shCON, HeLa_shALS2_1 or HeLa_shALS2_2 cells, treated with TNF/AcD +zVAD (6 hrs). IF of Rab5 and TOM70. Cells scored for mitochondrial Rab5. ≥ 800 cells per condition.
(E) MCF-7_shCON, MCF-7_ALS2_1 or MCF-7_shALS2 cells, in FM or treated with STS (4 hrs). IF of cytochrome c, scored for Cyto c– mitochondria. > 800 cells per condition.
(F) MCF-7_shCON, MCF-7_shALS2_1 or MCF-7_shALS2_2 cells, in FM or treated with STS (4 hrs). IF of cytochrome c and BAX. Cells scored for BAX+ mitochondria with retained cytochrome c (BAX+ / Cyto c+). > 500 cells per condition.
(G) HeLa_shCON, HeLa_shALS2_1 or HeLa_shALS2_2 cells, treated with STS (4 hrs) or TNFα/AcD (6 hrs) + zVAD. IF of cytochrome c and TOM20. Cells scored for Cyto c– mitochondria. > 800 cells per condition.
(H) MCF-7 cells transfected with GFP or GFP-ALS2, treated with TNFα/AcD (6 hrs). IF of cytochrome c and TOM20. Cells scored for Cyto c– mitochondria. > 800 cells per condition.
(I) MCF-7_Cyto c-GFP cells, IF of Rabex-5 and TOM70 at 4 hrs of STS. Zoom images and intensity profiles of ROIs. ROI 1), MOMP– cell; ROI 2), MOMP+ cell.
(J) MCF-7_Cyto c-GFP cells, IF of Rabex-5 and TOM70 at 6 hrs of TNFα/AcD. Zoom images and intensity profiles of ROIs. ROI 1), MOMP– cell; ROI 2), MOMP+ cell.
(K) MCF-7_GFP-BAX cells, IF of Rabex-5 and TOM70, in FM or at 6 hrs of TNFα/AcD, or 4 hrs of STS.
(L) Immunoblots of Rabex-5 protein levels in MCF-7_Cyto c-GFP (left) or MCF-7 (right) cells stably expressing shCON or shRabex-5.
(M) Immunoblot of Rabex-5 protein levels in HeLa cells stably expressing shCON or shRabex-5.
(N) MCF-7_Cyto c-GFP_shRabex-5 cells, imaged live every 5 sec for 2 min at 6 hrs TNFα/AcD. Left, merged channel image of single time-point. Middle, ROI time-series of merged channels with interactions overlaid in white. Right, color-coded time-step 2 min projection.
(O) HeLa_shCON or HeLa_shRabex-5 cells, treated with STS +zVAD (4 hrs) or TNFα/AcD +zVAD (6 hrs). IF of Rab5 and TOM20. Cells scored for Rab5+ mitochondria. > 150 cells per condition.
(P) MCF-7_shCON or MCF-7_shRabex-5 cells in FM or treated with STS (4 hrs), TNFα/AcD (6 hrs), or CPT (24 hrs). IF of cytochrome c and BAX. Cells scored for Cyto c+ mitochondria. > 550 cells per condition.
(Q) Cells, treatments, IF and graph representation as in (P). Cells scored for BAX+ mitochondria. > 550 cells per condition.
(R) Cells, treatments, IF and graph representation as in (P). Cells scored for BAX+ mitochondria with retained cytochrome c (BAX+ / Cyto c+). > 550 cells per condition.
(S) HeLa_shCON or HeLa_shRabex-5 cells, in FM or treated with STS +zVAD (4 hrs), or TNFα/AcD +zVAD (6 hrs). IF of cytochrome c and BAX. Cells scored for Cyto c– mitochondria. Graph, mean of n = 3 experiments. Error bars, standard deviation. > 200 cells per condition. *p ≤ 0.05
(T) Cells and treatments as in (S). Cells scored for BAX+ / Cyto c+ mitochondria. > 550 cells per condition.
(U) MCF-7_Cyto c-GFP cells expressing RFP-Rabex-5 or RFP-Rabex-5A58G (∆MIU), treated with STS (4 hrs) or TNFα/AcD (6 hrs). Cells scored for Cyto c-GFP– mitochondria.
Graphs, mean of n = 3 experiments. Error bars, standard deviation. > 150 cells per condition. NS, not significant; *p ≤ 0.05, ****p ≤ 0.0001
