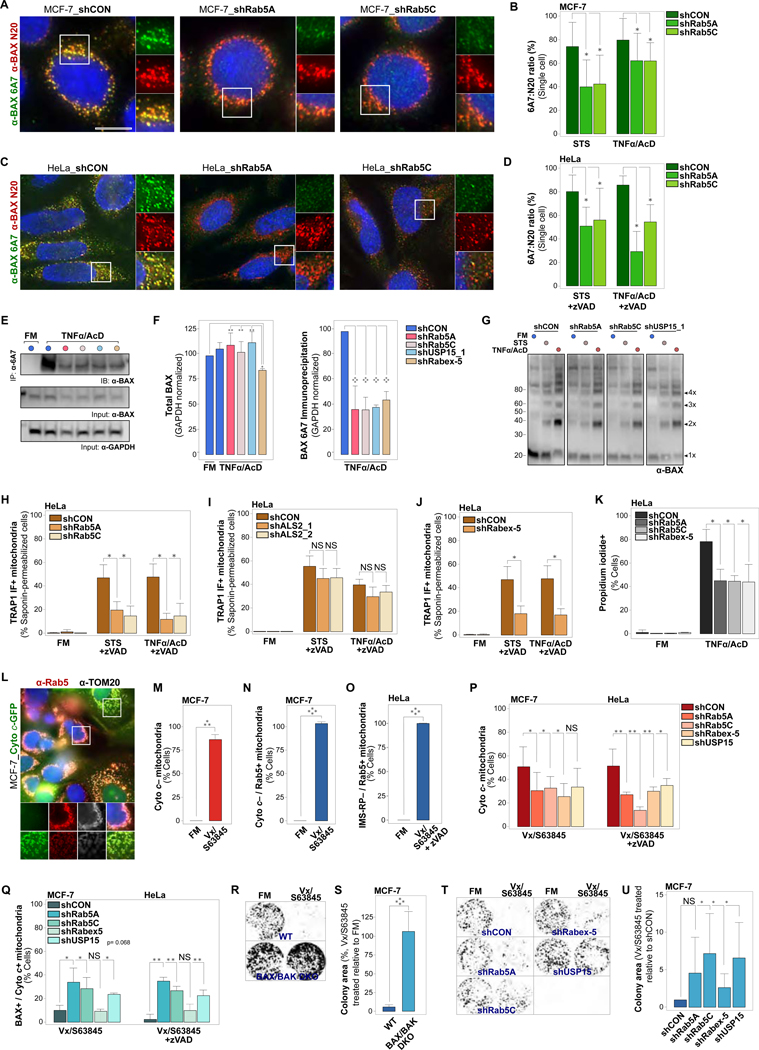
Figure 7. EL Targeting of Apoptotic Mitochondria Alters OMM Lipid Composition and Impacts BAX Pore Formation and Downstream Cell Death Signaling.

(A) MCF-7_shCON, MCF-7_shRab5A or MCF-7_shRab5C cells, treated with STS (4 hrs), or TNFα/AcD (6 hrs). IF of total cellular BAX (α-BAX N-20) and of BAX in active conformation (α-BAX 6A7).
(B) Quantification of cellular BAX 6A7 over N-20 ratios for cells as in (A). Differences between N20 and 6A7 fluorescence intensities calculated for individual cells. Graphs, plots of 10 cells per condition, from 1 experiment representative of n = 3.
(C) HeLa_shCON, HeLa_shRab5A or HeLa_shRab5C cells, treated with STS (4 hrs), or TNFα/AcD (6 hrs) + zVAD. IF of total cellular BAX (α-BAX N-20) and of BAX in active conformation (α-BAX 6A7).
(D) Quantification of cellular BAX 6A7 over N-20 ratios for cells as in (C), calculated and graphed as in (B). Graphs, plots of 19 cells per condition, from 1 experiment representative of n = 3.
(E) MCF-7 cells stably expressing shCON, shRab5A, shRab5C, shRabex-5 or shUSP15_1, treated with TNFα/AcD (6 hrs). Immunoprecipitation of 6A7 epitope-exposed BAX conformer using α-BAX 6A7. Immunodetection of BAX using α-BAX N20. GAPDH, loading control.
(F) Left, Quantification of total BAX (N-20) in input, normalized to GAPDH, from n = 3 as in(E). Right, Quantification of BAX 6A7 immunoprecipitates, normalized to GAPDH, from n = 3 as in (E).
(G) Immunoblot of MCF-7 cells stably expressing shCON, shRab5A, shRab5C or shUSP15_1, crosslinked with DSS in FM or at 4 hrs STS or 6 hrs TNFα/AcD. Immunodetection of total BAX. All membrane crops stem from the same membrane and were scanned and processed with identical settings.
(H) HeLa_shCON, HeLa_shRab5A or HeLa_shRab5C cells, in FM, or treated with STS (4 hrs) or TNFα /AcD (6 hrs) +zVAD. IF of saponin-permeabilized cells (saponin-IF) for TOM20 and TRAP1. Cells scored for TRAP1 saponin-IF+ mitochondria. Graphs, mean of n = 3 experiments. >150 cells per condition.
(I) HeLa_shCON, HeLa_shALS2_1 or HeLa_shALS2_2 cells, in FM, or treated with STS (4 hrs) or TNFα/AcD (6 hrs) +zVAD. Saponin-IF of TOM20 and TRAP1. Cells scored for TRAP1 saponin-IF+ mitochondria. Graphs, mean of n = 2 experiments. > 100 cells per condition.
(J) HeLa_shCON or HeLa_Rabex-5 cells, in FM, or treated with STS (4 hrs), or TNFα/AcD (6 hrs) +zVAD. Saponin-IF of TOM20 and TRAP1. Cells scored for TRAP1 saponin-IF+ mitochondria. Graphs, mean of n = 3 experiments. > 550 cells per condition.
(K) HeLa_shCON, Hela_shRab5A, HeLa_shRab5C and HeLa_shRabex-5, treated with TNF α/AcD (6 hrs), stained with Hoechst and propidium iodide (PI), scored for PI+ cells. Graphs, mean of n = 3 experiments. > 175 cells per condition.
(L) MCF-7_Cyto c-GFP cells, in FM or treated with Vx/S63845 (10 μM/5 μM) for 6 hrs, IF of Rab5 and TOM20.
(M) Cells from (L) were scored for mitochondria with released cytochrome c (Cyto c–). Graph, mean of n = 3 experiments. ≥ 175 cells per condition.
(N) Cells from (L) were scored for Cyto c– mitochondria targeted by Rab5 (Cyto c– / Rab5+). Graph, mean of n = 3 experiments. ≥ 175 cells per condition.
(O) HeLa_IMS-RP cells, in FM or treated with Vx/S63845 +zVAD for 6 hrs. IF of Rab5 and TOM20. Cells scored for mitochondria with released IMS-RP targeted by Rab5 (IMS-RP– / Rab5+). Graphs, mean of n = 3 experiments. ≥ 175 cells per condition.
(P) MCF-7 and HeLa shCON, shRab5A, shRab5C, shRabex-5 and shUSP15 KD cells in FM or treated for 6 hrs with Vx/S63845 or Vx/S63845 +zVAD, respectively. IF of BAX and cytochrome c. Cells scored for Cyto c– mitochondria. Graphs, mean of n = 3 experiments. > 170 cells per condition.
(Q) Cells as in (P), scored for BAX+ mitochondria with retained cytochrome c (BAX+ / Cyto c+). ≥ 170 cells per condition.
(R) MCF-7 WT and BAX/BAK DKO cells were treated with Vx/S63845 for 6 hrs. Representative images of colony formation at 7 days following treatment.
(S) Quantification of colony area for experiment in (R). n = 3 experiments.
(T) MCF-7_shCON, shRab5A, shRab5C, shRabex-5 and shUSP15 cells were treated with Vx/S63845 for 6 hrs. Representative images of colony formation at 7 days following treatment.
(U) Quantification of colony area for experiment in (T). n = 5 experiments.
Nuclei stained with Hoechst. Scale bars, 10 μm. Graphs: Error bars, standard deviation. NS, not significant, *p < 0.05, **p ≤ 0.01, ****p ≤ 0.0001
