Figure 2.

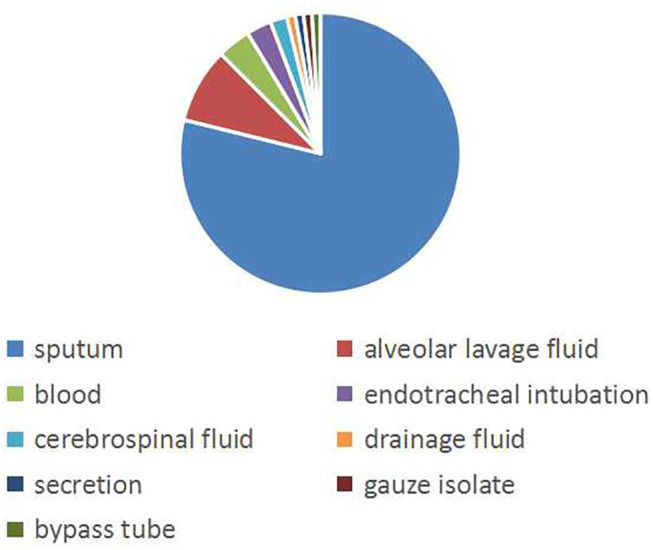
The isolation source of the specimen. The pie graph shows the source of the strains. Blue represents the majority of strains isolated from sputum.

The isolation source of the specimen. The pie graph shows the source of the strains. Blue represents the majority of strains isolated from sputum.