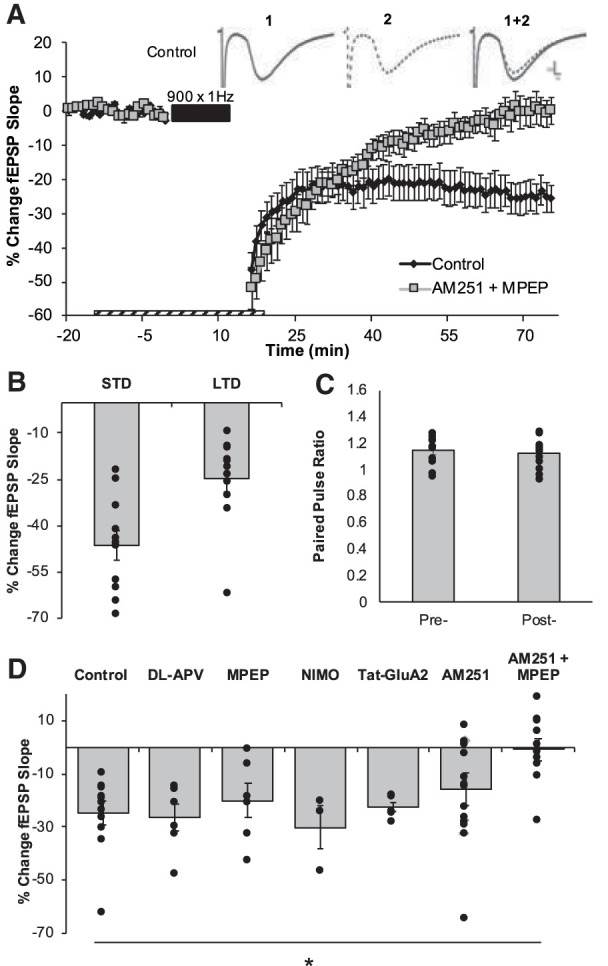
Figure 3.

900 × 1 Hz-LFS induced LTD is dependent on coactivation of mGluR5 and CB1R. (A) LTD was measured as the average percentage of change in the fEPSP slope relative to baseline for minutes 70–75 as a result of the delivery of the 900 × 1 Hz LFS (indicated as black bar). Dashed bar represents the duration of exposure of pharmacological inhibitors. Numbers 1 and 2 indicate the relative timing that corresponds to the representative traces. Representative field excitatory postsynaptic potentials (fEPSPs) from the preconditioning period (1, solid black line) and from the end of the postconditioning recording (2, dotted black line). Scale represents 0.2 mV by 1 msec. (B) The average magnitudes of STD and LTD are indicated as the last 5 min of the postconditioning recordings. Bars represent the average LTD (−24.85 ± 4.30%, n = 11 slices) induced by 900 × 1 Hz in the control data set. Dots represent the average amounts of STD and LTD for each slice that make up this data set. (C) The paired pulse ratios evaluated before the induction of LTD and at the end of the postconditioning recording were not statistically significantly different, providing indications that this LTD is not mediated by a change to presynaptic neurotransmitter release probability. (D) Pharmacological inhibition of NMDAR (−26.68 ± 5.11%, n = 6 slices, P = 0.789), mGluR5 (−20.15 ± 6.40%, n = 6 slices, P = 0.556), L-type calcium channels (Nimodipine, NIMO; −26.80 ± 2.88%; n = 2 slices, P = 0.731), Tyr phosphorylation on AMPARs (Tat-GluA23Y; −22.79 ± 1.63%; n = 6 slices, P = 0.235) or CB1R (−15.83 ± 6.24%, n = 17 slices, P = 0.173) independently had no effect on this LTD. Combined inhibition of mGluR5 and CB1R led to a significant blockade of LTD (−0.82 ± 4.14%, n = 10 slices, P = 0.00055). Dots represent the average amounts of LTD for each slice that make up the average (indicated as the bar) for each group. Error bars throughout represent the standard error of the mean. Statistical significance was achieved by a two-tailed t-test compared against control and P < 0.05 is indicated by a *.
