
Figure 4.
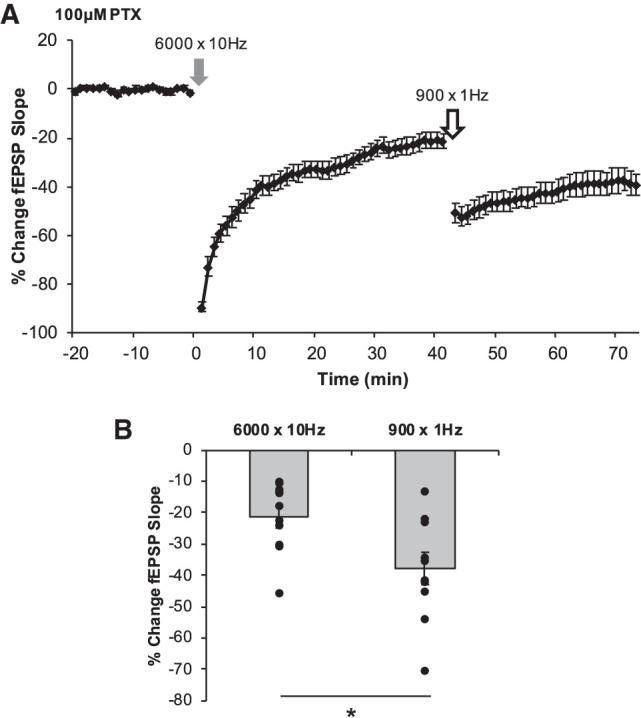
Establishment of LTD by 6000 × 10 Hz does not occlude further LTD induced by 900 × 1 Hz. The magnitudes of LTD by any form of conditioning stimulus were determined from the average percent change in the fEPSP slope of the last 5 min of each postconditioning recording relative to the original baseline. (A) Following 40 min of postconditioning recordings after 6000 × 10 Hz (gray arrow; A), 900 × 1 Hz LFS was delivered (white arrow) followed by a second postconditioning recording for 30 min. The average magnitudes of each LTD are represented in B for each corresponding experiment. 6000 × 10 Hz LTD (−21.23 ± 3.67%, n = 11 slices) did not occlude further LTD by 900 × 1 Hz LFS (−37.99 ± 5.02%, P = 0.00176). (B) Bars represent average magnitudes of LTD induced by each conditioning stimulus. Dots represent the average amounts of LTD for each slice that make up the average (indicated as the bar) for each group. Error bars throughout represent the standard error of the mean. Statistical significance was achieved by a two-tailed t-test compared against control and P < 0.05 is indicated by a *.