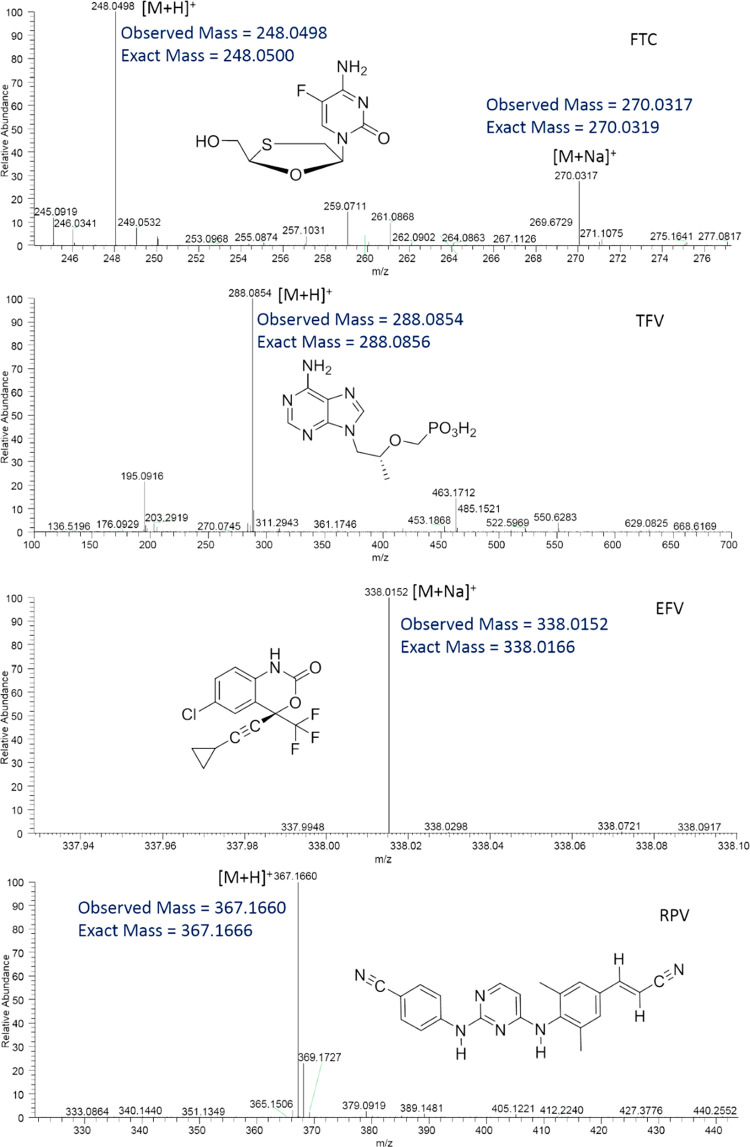
Figure 1.
MALDI MS ionization of FTC, TFV, EFV, and RPV using the CHCA matrix and positive polarity of the instrument. Representative full scan mass spectra of FTC, TFV, EFV, and RPV exhibiting their detection. Drug molecules, FTC, TFV, EFV, and RPV were detected at m/z 248.0498 (sodium adduct, 270.0317), 288.0854, 338.0152, and 367.1660, respectively.

