Figure 4.
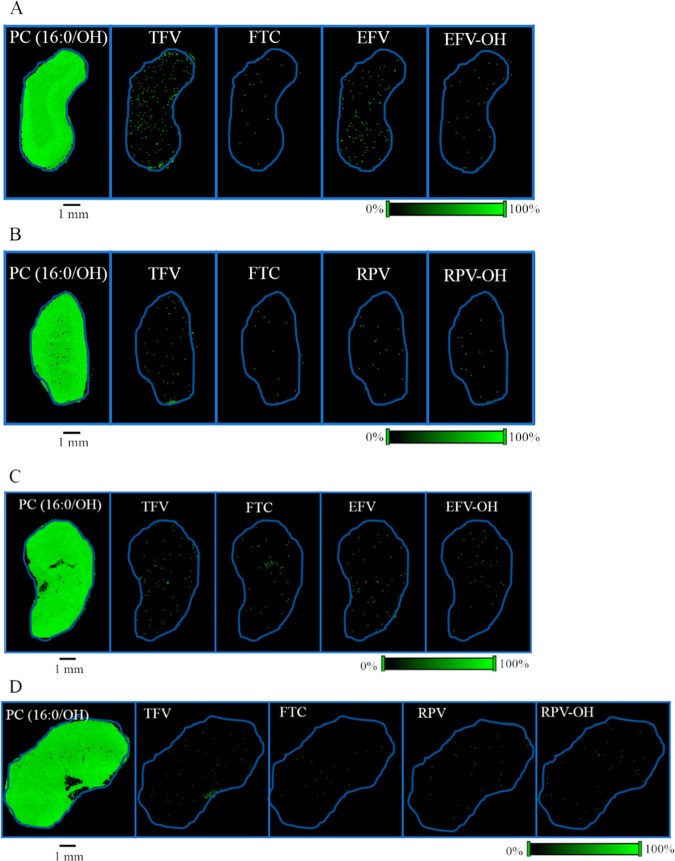
Spatial distribution of TFV, FTC, EFV, and RPV in mouse kidney. Distribution profiles of PC (16:0/OH), TFV, FTC, EFV, and EFV–OH in kidney sections obtained from (A) female and (C) male mice after in vivo dosing of TFV–FTC–EFV. Distribution profiles of PC (16:0/OH), TFV, FTC, RPV, and RPV–OH in kidney sections of (B) female and (D) male mice following in vivo oral dosing of TFV–FTC–RPV. Mice were administered drugs via their drinking water for 28 days and then sacrificed. Spatial resolution for MALDI MS ion images was 50 μm. The green color represents the highest signal intensity (100%), whereas the black color depicts the lowest signal (0%) of the ion of interest. Scale bar, 1 mm.

