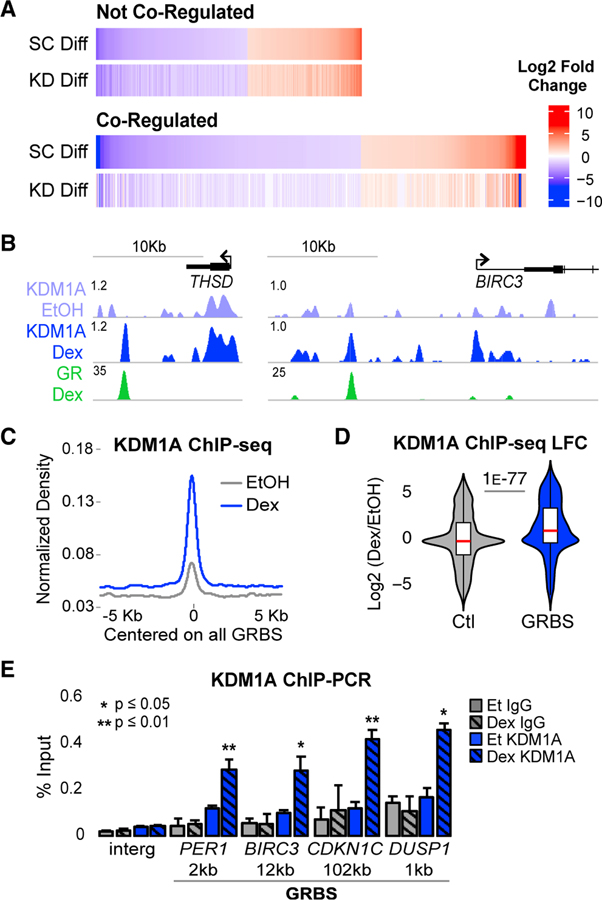
Figure 1. KDM1A Is a Key GR Co-regulator Recruited to GR Binding Sites.
(A) RNA-seq heatmaps of Dex-regulated genes with ≥2-fold change (adjusted p value [padj] < 0.05) between Dex and EtOH in control shRNA transduced cells (SC Diff). Co-regulated genes were Dex-regulated genes that failed to meet the Dex-regulated threshold or had a ≥2-fold defect in Dex response in KDM1A shRNA-transduced cells (KD Diff). See also Figures S1A–S1E.
(B) ChIP-seq profiles in fragments per kilobase million (FPKM) normalized to input at two representative Dex-induced, GR-KDM1A coregulated genes. See also Figures S1F and S1G.
(C) KDM1A ChIP-seq density. Input-normalized FPKM averaged for all GR peak regions and plotted aligned by peak center. The x axis shows distance in kb from peak center. All density plots generated similarly.
(D) Dex-induced log2 fold change (LFC) in KDM1A density at all GR peak regions (GRBSs). Control (Ctl) regions are annotation-matched DNase I hypersensitive sites that do not overlap a GRBS. p value by Mood’s median test. See also Figure S1H.
(E) KDM1A (blue) and immunoglobulin G (IgG) (gray) ChIP-qPCR at the GRBS nearest each of four Dex-induced genes and an intergenic control region (Interg). Distance to TSS in kb. Bars plot mean + SE of three to five biological replicates. p values, Student’s t test between EtOH and Dex for each antibody. See also Figures S1I–S1K.

