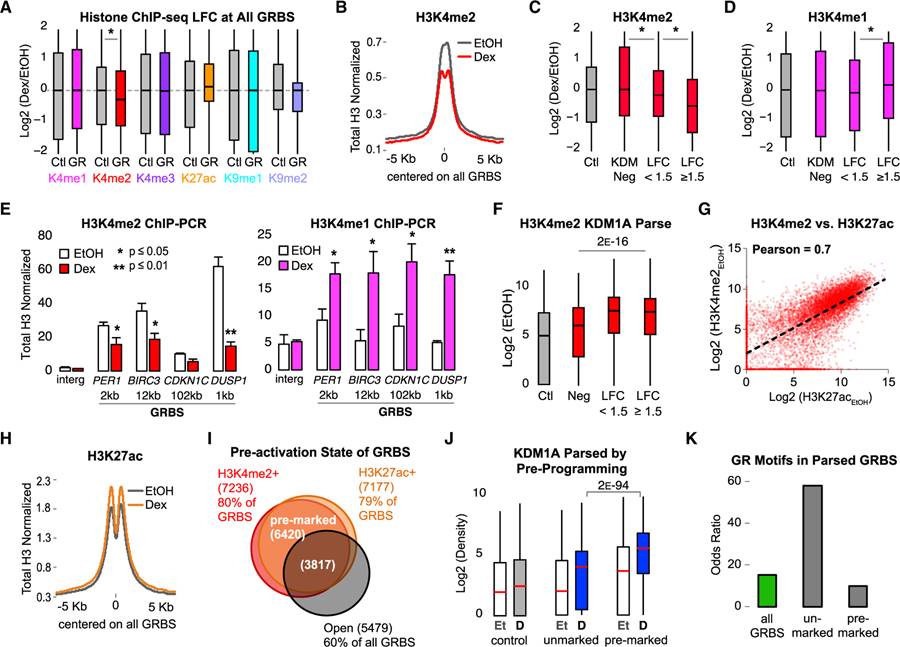
Figure 3. Preprogramed H3K4me2 Is Demethylated upon GR Activation at KDM1A-Bound GRBSs.
All histone ChIP-seq densities normalized to input and total H3, quantified ± 250 bp from GRBS or Ctl region center.
(A) Boxplots showing interquartile range and median ChIP-seq LFC at all GRBSs (GR) and Ctl regions. Asterisk indicates p value < 1 E−9 by Mood’s median test. See also Figure S3A.
(B) Average H3K4me2 ChIP-seq density at GRBSs. See also Figure S3B.
(C and D) ChIP-seq LFC in H3K4me2 (C) and H3K4me1 (D) at parsed GRBSs. KDM Neg, GRBSs with KDM1A density < median Ctl (n = 2217); LFC < 1.5, constitutive KDM1A-bound GRBSs with log2(KDM1ADex/KDM1AEtOH) < 1.5 (n = 2917); and LFC ≥ 1.5, GRBSs that recruit KDM1A with log2(KDM1ADex/ KDM1AEtOH) ≥ 1.5 (n = 3962). Asterisk, p < 4 E−12 for indicated pairs by Bonferroni-corrected pairwise Mood’s median test. See also Figures S3C–S3E.
(E) ChIP-qPCR of H3K4me2 (red) and H3K4me1 (magenta) normalized to input and H3 at GRBSs near Dex-induced genes (as in Figure 1E). Bars plot mean + SE of three or four biological replicates; p value, Student’s t test between EtOH and Dex. See also Figure S3F.
(F) H3K4me2 ChIP-seq prior to GR activation (EtOH) at GRBSs parsed as in (C). p value, Mood’s median test for the three indicated groups.
(G) H3K4me2 versus H3K27ac at all GRBSs in EtOH-treated cells. Pearson correlation coefficient = 0.7. See also Figures S3G and S3H.
(H) Average H3K27ac ChIP-seq density at all GRBSs.
(I) Venn diagram of GRBS preprogrammed states. Pre-marked GRBSs had both H3K4me2 and H3K27ac. Unmarked GRBSs lacked both H3K4me2 and H3K27ac. Open GRBSs had high DNase I signal in EtOH.
(J) Boxplots of KDM1A density at GRBSs parsed by preprogrammed state as in (I). p value for indicated pair from Bonferroni-corrected pairwise Mood’s median test. Et, EtOH control; D, Dex treated.
(K) Enrichment of the consensus GR motif. Odds ratio over control regions is plotted.

