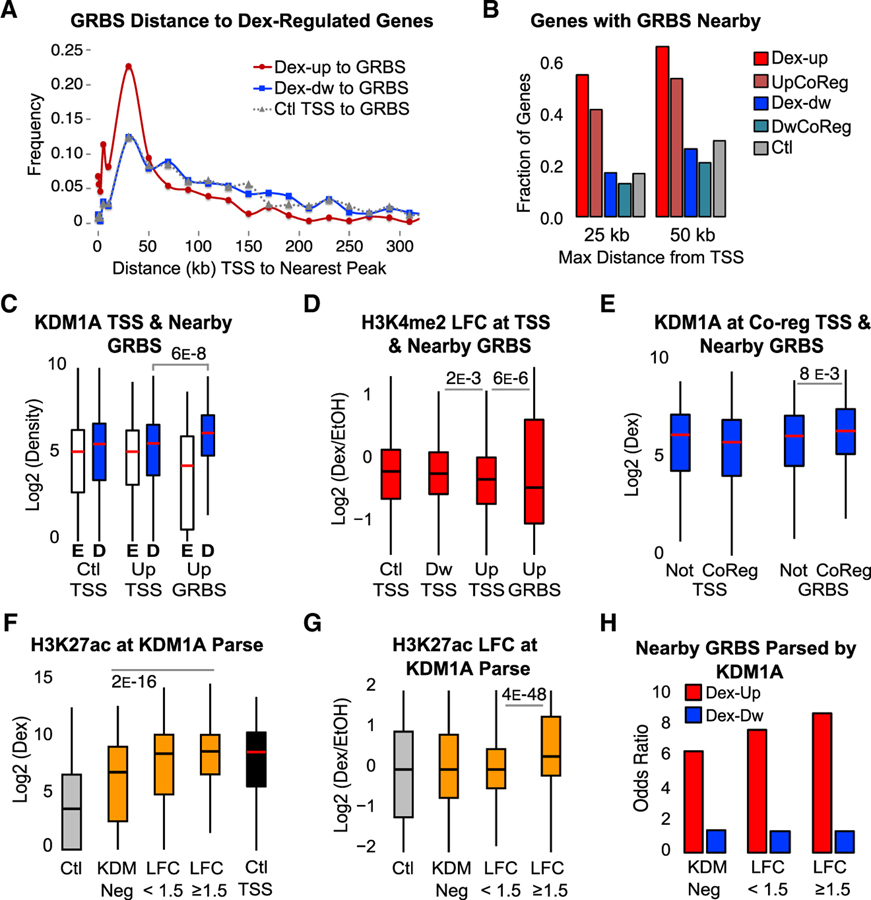
Figure 4. KDM1A Functions at Active Enhancers to Remove H3K4me2.
(A) Binned distances between nearest GRBS and TSSs of Dex-induced (Dex-up), Dex-repressed (Dex-dw), or Ctl genes.
(B) Fraction of genes with a GRBS or control region ± 25 kb or ± 50 kb from the TSS for each gene group. UpCoReg, Dex-induced GR-KDM1A coregulated genes; DwCoReg, Dex-repressed GR-KDM1A coregulated genes.
(C and D) ChIP-seq KDM1A density (C) and H3K4me2 LFC (D) at the TSS of control genes (Ctl TSS), Dex-up genes (Up TSS), Dex-dw genes (Dw TSS), and GRBSs ± 25 kb of a Dex-up gene (Up GRBS). E, EtOH; D, Dex. Density quantified ± 250 bp from TSS or GRBS center. See also Figure S4A.
(E) KDM1A density after Dex at TSSs or Up GRBSs parsed by genes that are co-regulated (CoReg) or not co-regulated (Not) as defined in Figure 1A.
(F and G) H3K27ac ChIP-seq density (F) and LFC (G) at parsed GRBSs as in Figure 3C. TSSs of control genes are included for reference. See also Figures S4B and S4C.
(H) GRBSs ± 25 kb from the TSS of a Dex-responsive gene parsed by KDM1A status, as in Figure 3C. Odds ratio over control regions is plotted.
All ChIP-seq p values from Bonferroni-corrected pairwise Mood’s median test.

