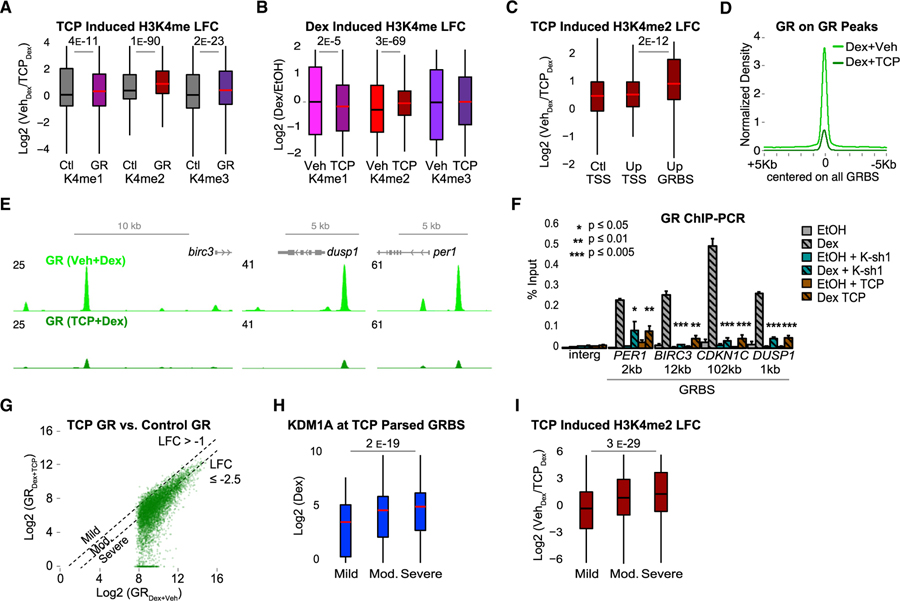
Figure 5. KDM1A-Mediated H3K4me2 Demethylation Promotes GR Binding.
Cells were treated with TCP or DMSO vehicle (Veh) for 24 h prior to Dex or EtOH.
(A and B) TCP-induced (A) and Dex-induced (B) changes in H3K4 methylation ChIP-seq. LFC in (A) calculated as log2(K4meTCP/K4meVeh) after Dex. Ctl, control regions; GR, GRBSs. LFC in (B) calculated as log2(K4meDex/K4meEtOH) in TCP or Veh-treated cells. p value, Mood’s median test. See also Figures S4D–S4F and S5A–S5E.
(C) TCP-induced H3K4me2 ChIP-seq LFC at Ctl TSS, Up TSS, and Up GRBSs (as in Figures 4C and 4D).
(D) Average GR ChIP-seq density at all GRBSs.
(E) Representative GRBSs with loss of GR binding after TCP. Input normalized GR ChIP-seq profiles in FPKM for control (light green) and TCP (dark green).
(F) GR ChIP-qPCR at GRBSs near Dex-induced genes (as in Figure 1E). Gray bars, control shRNA; teal bars, KDM1A shRNA (K-sh1); and brown bars, TCP. Bars plot mean + SE of three to six biological replicates; p value, Student’s t test comparing Dex versus Dex + K-sh1 or Dex + TCP.
(G) GR density at all GRBSs in cells treated with TCP (Dex + TCP, y axis) versus DMSO (Dex + Veh, x axis). Dashed lines indicate thresholds used to define groups in (H) and (I). Mild, LFC > −1 (n = 494); moderate, LFC between −1 and −2.5 (n = 3999); and severe, LFC ≤ −2.5 (n = 4605). See also Figures S5F and S5G.
(H and I) KDM1A ChIP-seq density (H) and TCP-induced H3K4me2 LFC (I) at GRBSs parsed by GR loss as in (G).
p values for indicated groups in ChIP-seq boxplots by Mood’s median test.

