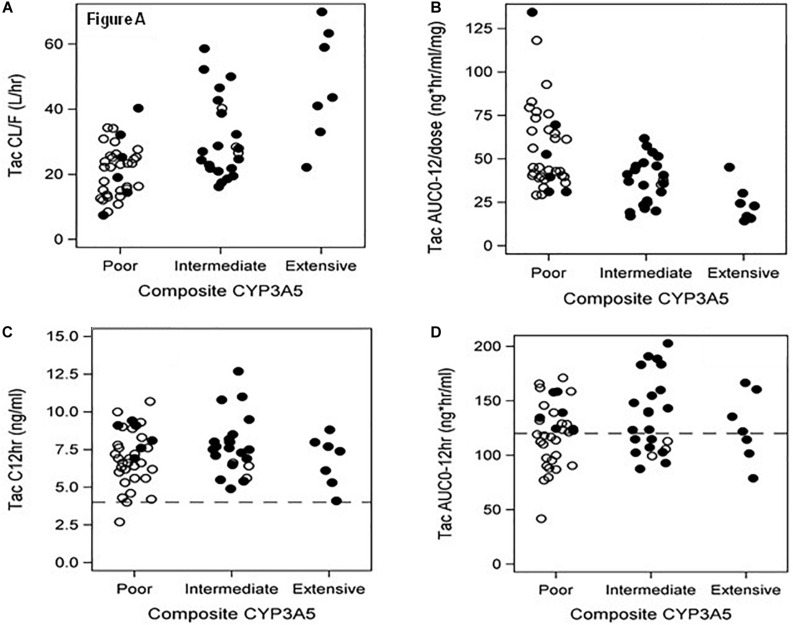
FIGURE 2.
(A–D) Metabolic Composite for CYP3A5*3*6*7 and associations to tacrolimus pharmacokinetic parameters – (A) represents tacrolimus clearance classified by 3 metabolic composite groups for CYP3A5*3*6*7. The Extensive Metabolizers are all Blacks with more rapid clearance than Poor Metabolizers (P < 0.001), who were primarily Whites. (B) depicts dose normalized AUC 0–12 with Poor Metabolizers with twice the dose normalized tacrolimus exposure compared to Extensive Metabolizers (P < 0.001); (C) presents tacrolimus troughs divided by metabolic composite groups using the target range of >4 ng/ml and <15 ng/ml for our study. No difference was found between these groups. Note that 64 of 65 patients are within the therapeutic trough range. (D) depicts AUC0–12 h graphs of the metabolic composite groups using the tacrolimus target of >120 and ≤200 ng.hr/ml (Wallemacq et al., 2009). Note that 17/32(53%) of Whites and 10/33(30%) of Blacks had 12-h tacrolimus exposures <120 ng.hr/ml distributed across all groups in spite of the therapeutic troughs (C). OPEN Circle = Whites; CLOSED Circle = Blacks.

