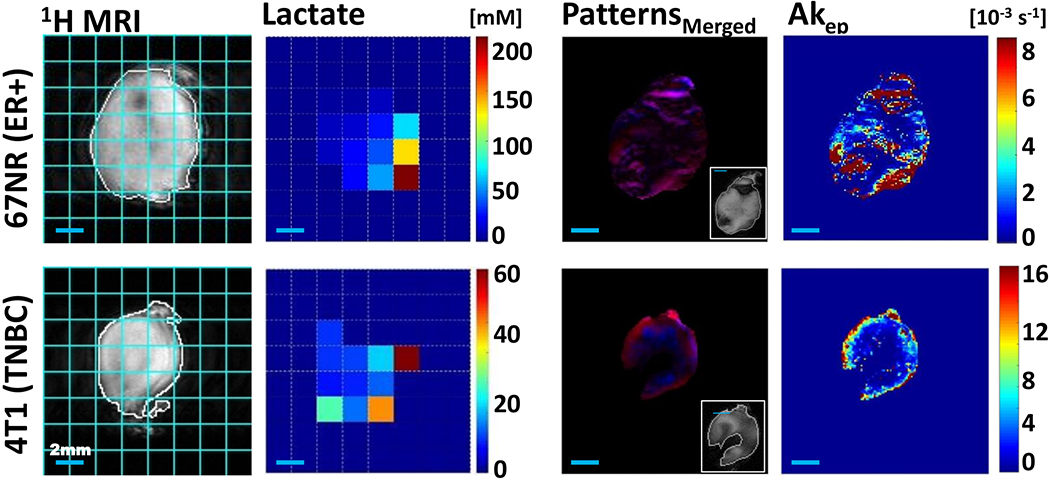
FIGURE 2.

In vivo comparison of the spatial metabolic and vascular structural intra-tumoral heterogeneity of 67NR and 4T1 tumors. Spatially mapped tumor lactate concentrations and tumor vascularity-based characteristics for a representative 67NR (top row) and 4T1 (bottom row) tumor respectively, both grown orthotopically in the mammary fat pad of BALB/c mice (same tumors as shown in Figure 4). 1H MRI: 1H MRI of tumor in the slice used to map lactate for the entire tumor, overlaid with tumor outline (white) and pixel grid, corresponding to the pixels of the lactate map (cyan); Lactate: Lactate concentration map with a 36 and 20 mm3 pixel size for the 67NR and 4T1 tumor respectively (2 mm × 2 mm in-plane spatial resolution; 9- and 5-mm slice thickness for the shown 67NR and 4T1 tumor respectively); Patterns Merged: The spatial distribution of CA uptake patterns in the outermost 1-mm tumor slice of the DCE-MRI acquisition (most closely aligned to the optical imaging slice)—red, well perfused (fast CA washin and washout), blue: necrosis (slow CA washin, with no major washout) with a pixel size of 0.0137 mm3 for the 67NR and 0.0156 mm3 for the 4T1 tumor; the inset shows the corresponding anatomical MRI of the 1-mm tumor slice; Akep: To the pattern map corresponding Akep map. The approximate measure of tumor blood flow and permeability, Akep, consists of the amplitude A, depicting relative MR signal enhancement, and the exchange rate kep, reflecting MR signal increase velocity [40]. CA, contrast agent; DCE-MRI, dynamic contrast-enhanced MRI; MRI, magnetic resonance imaging.
