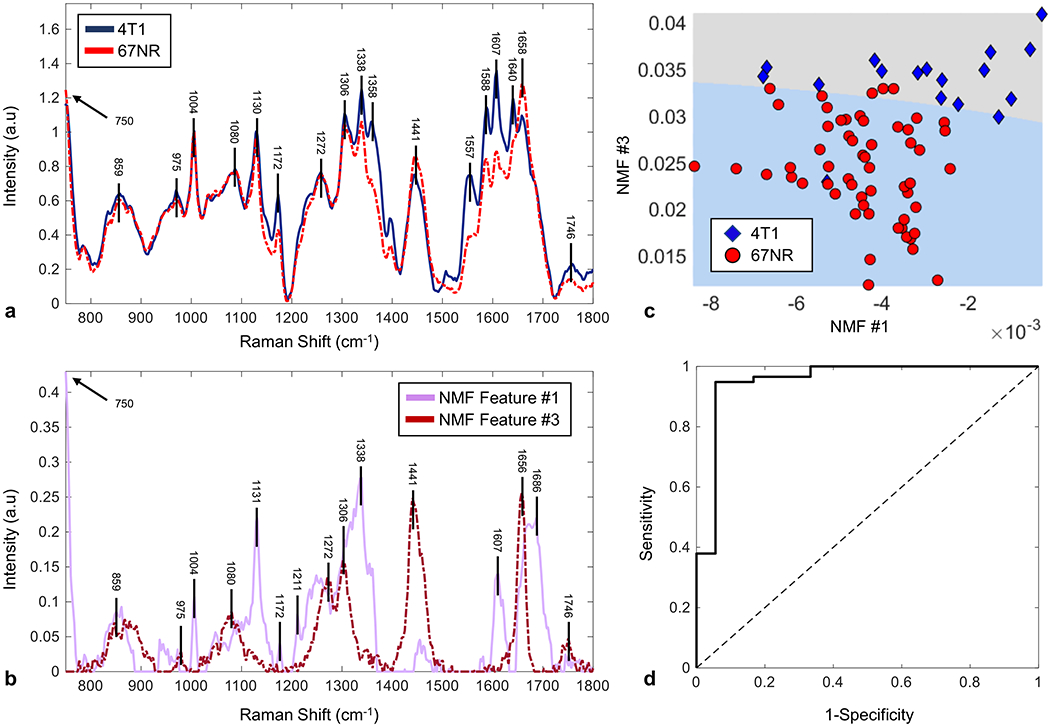
FIGURE 5.

NMF analysis of resonance Raman spectra identifies distinguishing features between 67NR and 4T1 tumors. A, Representative resonance Raman spectra of 4T1 (solid, blue) and 67NR tissues (dotted, red), background subtracted and normalized to the intensity at 1006 cm−1. Prominent peaks in both spectra have wavenumbers indicated above 4T1 spectra. Differences in peak intensity are most obvious for the peaks at 1090, 1339, 1358, 1395, 1446, 1554, 1587, 1610, 1639, and 1658 cm−1. B, NMF-extracted feature spectra showing the two feature spectra used to obtain the highest accuracy and SVM separation. Feature spectrum #1 is the solid, pink line and Feature spectrum #3 is the dotted, red line. C, 2D SVM separation using the feature spectra displayed in B. Weights of the given feature spectra 1 and 3 for 67NR (red circle) and 4T1 (blue diamond) indicate degree to which a given RR spectrum is composed of a given feature spectrum. The shallow slope of the line indicated that feature spectrum #3 is the primary separator between the two tumor types. D, AUROC separation demonstrates a cross-validated characterization accuracy of 92.1% along with the sensitivity of 96.6% and specificity of 77.8% to distinguish 67NR (n = 5) from 4T1 tumors (n = 9). AUROC, area under the receiver operating curve; NMF, nonnegative matrix factorization; RR, resonance Raman; SVM, support vector machine
