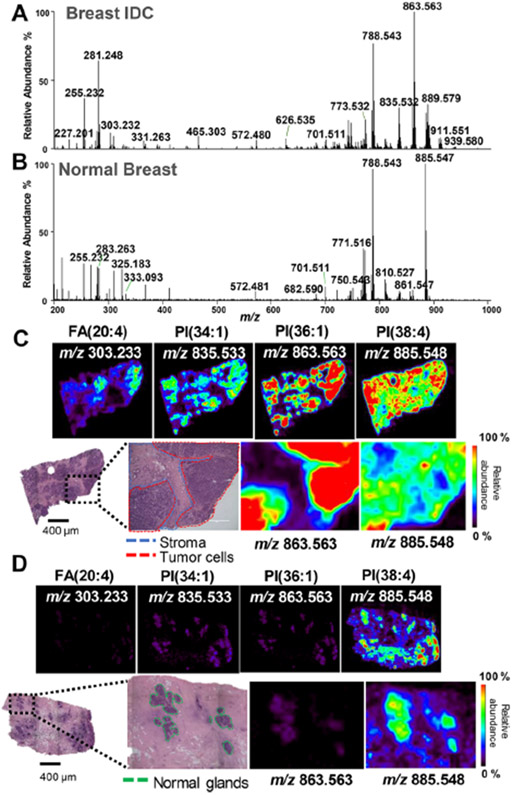
Figure 1.
Negative-ion-mode DESI-MSI of IDC and normal breast tissues. (A) Representative profile for the IDC-tissue region. (B) Representative profile for the normal-breast-tissue region. (C) Representative ion images for the IDC-tissue sample and optical images of the H&E stained tissue section. (D) Representative ion images for the normal-tissue sample and optical images of the H&E stained tissue section. Tumor areas are outlined in red on H&E slides. Areas of red intensity within the ion images represent the highest (100%) relative abundances, whereas black represents the lowest (0%). PI: glycerophosphoinositol, PS: glycerophosphoserine, FA: fatty acid. Lipid species are described by the numbers of fatty acid chain carbons and double bonds.

