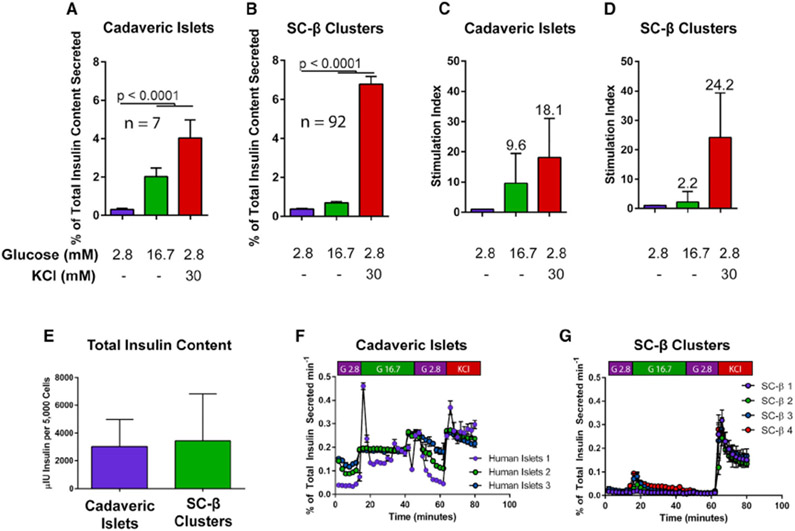
Figure 1. Insulin Secretion Profiles in SC-β Cells.
(A and B) Glucose response profile of human cadaveric islets (n = 7) (A) and differentiated SC-β cells (n = 92) (B) challenged with low glucose (2.8 mM), high glucose (16.7 mM), or KCl (30 mM) in low-glucose buffer for 60 min.
(C and D) Stimulation index of cadaveric islets (C) and SC-β cells (D) after glucose or KCl challenge. Stimulation indices are indicated above each column.
(E) Total insulin content profile of human cadaveric islets and SC-β cells (n = 7 and 24 for human islets and SC-β cells, respectively).
(F and G) Dynamic perifusion insulin secretion profile of cadaveric islets (n = 3) (F) and SC-β cells (n = 4) (G).
Statistical analysis was carried out using two-way ANOVA with Dunnett’s correction for multiple hypothesis testing. For all experiments shown, color denotes a unique biological replicate within an experiment. Replicates within a biological group are the same color. Data are represented as mean ± SD.

