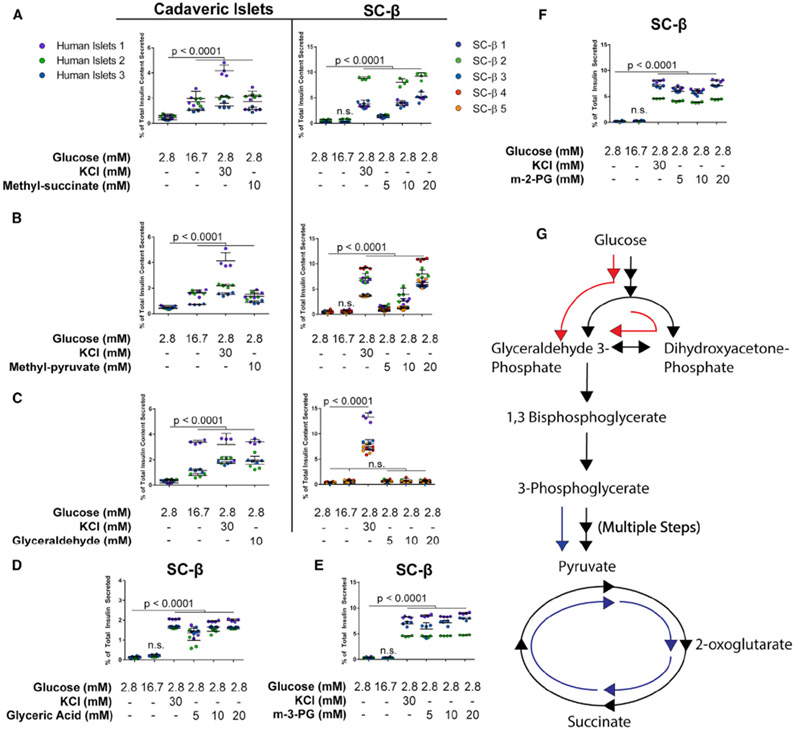
Figure 4. Some Cell-Permeable Intermediates Drive Insulin Secretion in SC-β Cells.
Intermediate metabolite insulin secretion responses for cadaveric islets and SC-β cells. Cadaveric islets or differentiated SC-β cells were dissociated and reaggregated for 48–72 h before 1-h incubation in indicated conditions after a 2-h fast at 2.8 mM glucose.
(A) Mono-methyl succinate response profiles in cadaveric islets (left) and SC-β cells (right).
(B and C) Response profiles to methyl-pyruvate (B) and glyceraldehyde (C) in cadaveric islets and SC-β cells.
(D) SC-β response to glycerate.
(E) SC-β response to methyl-3-phosphoglyerate (m-3-PG).
(F) SC-β response to methyl-2-phosphoglyerate (m-2-PG).
(G) Schematic representation of metabolite effects on SC-β cell insulin secretion. Metabolites entering the TCA cycle or late glycolysis successfully induce insulin release (blue arrows). Cell-permeable metabolites of early glycolysis or glucose itself generate a much smaller magnitude of insulin release (red arrows).
Data points are individual replicate values. Colors denote separate batches of differentiated cells, treated as biological replicates. The p values were calculated using a two-way ANOVA with Dunnett’s multiple testing correction. For all experiments shown, color denotes a unique biological replicate within an experiment. Replicates within a biological group are the same color. Data are represented as mean ± SD.

