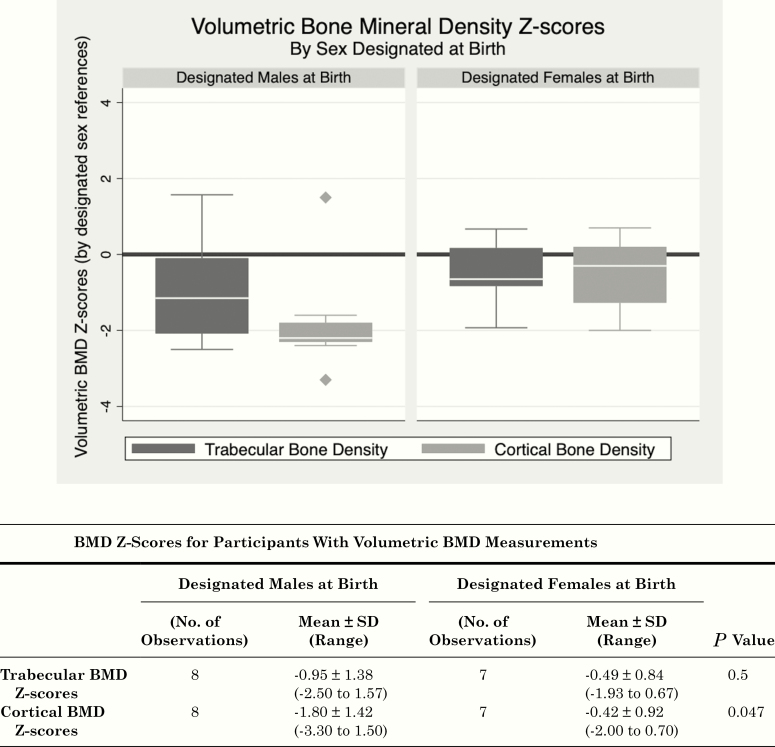
Figure 3.
Volumetric bone mineral density Z-Scores. Boxplots of volumetric BMD Z-scores (determined by reference standards for sex designated at birth) at two sites (trabecular bone density: L1-L3 vertebral bodies; cortical bone density: midshaft femur) are shown for designated males at birth (left) and designated females at birth (right). Boxes represent the interquartile ranges (IQR, 25th-75th percentile), white bars mark the median values, the whiskers show minimum (quartile 1-1.5 * IQR) and maximum values (quartile 3 + 1.5 * IQR), and points show outliers. BMD, bone mineral density.

