
Figure 2. Mitochondrial Localization and Opa1 Interaction of GR80.
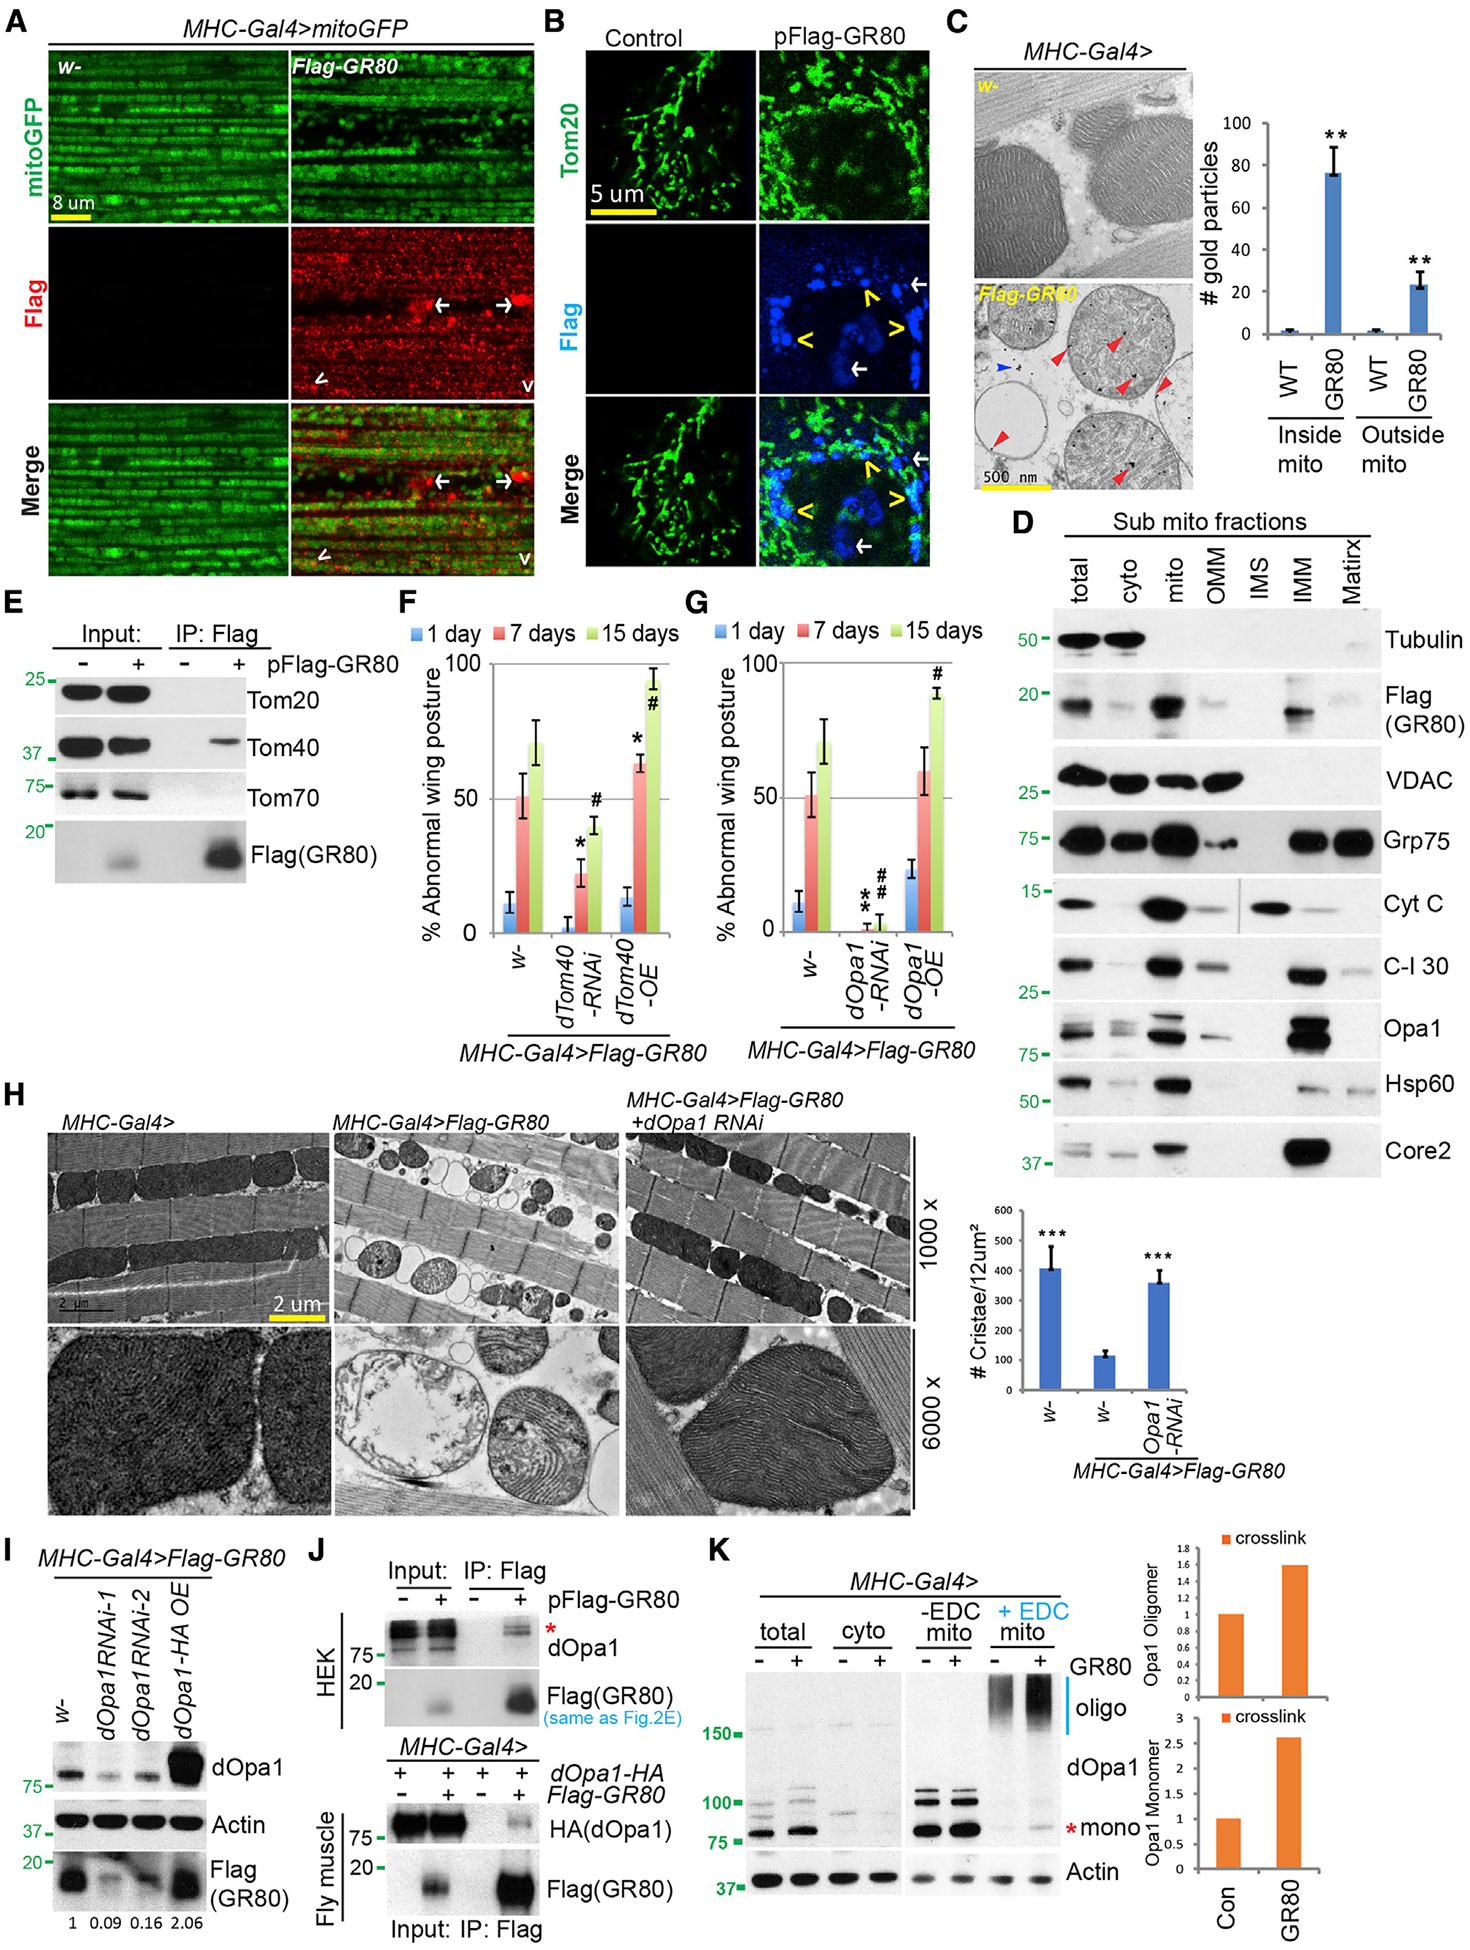
(A and B) Immunostaining showing mitochondrial localization of FLAG-GR80 in transgenic fly muscle (A) or transfected HeLa cells (B). Mito-GFP (A) or Tom20 staining (B) marks the mitochondria. Arrowhead: mitochondrial localization; arrow: non-mitochondrial localization. The images are representative of 3 independent samples.
(C) Immuno-EM analysis showing mitochondrial localization of FLAG-GR80 in fly muscle. Red and blue arrows mark the signals inside and outside the mitochondria, respectively. The graph shows quantification (n = 4, 3 biological repeats).
(D) Immunoblots of sub-mitochondrial fractions, with various mitochondrial marker proteins showing localization pattern of FLAG-GR80.
(E) CoIP assays using FLAG-GR80-transfected HEK293T cells to show specific GR80-Tom40 interaction.
(F) Bar graph showing quantification of the effect of Tom40 RNAi or overexpression (OE) on the wing posture in GR80 flies (n = 90 flies, 3 biological repeats).
(G) Bar graph showing quantification of the effect of Opa1 RNAi or OE on GR80 induced wing posture defect (n = 90 flies, 3 biological repeats).
(H) TEM images showing effect of Opa1 RNAi on GR80-induced mitochondrial morphology defect in fly thoracic muscle. The graph shows quantification (n = 5 sections, 3 biological repeats).
(I) Immunoblots showing effect of Opa1 RNAi or OE on GR80 protein level in GR80 fly muscle.
(J) CoIP assay showing GR80-Opa1 interaction in HEK293T cells (top) and fly muscle (bottom).
(K) Immunoblots showing effect of GR80 on Opa1 oligomer formation in fly thoracic muscle. 1-Ethyl-3- (3-dimethylaminopropyl)-carbodiimide (EDC) was used to cross-link Opa1. The positions of Opa1 monomer (mono) and oligomers (oligo) are indicated. The graph shows quantification (n = 2).
*p < 0.05, #p < 0.05, **p < 0.01, and ##p < 0.01, 1-way ANOVA test followed by SNK test plus Bonferroni correction. The immunoblots are representative of at least 2 independent repeats. See also Figure S2.