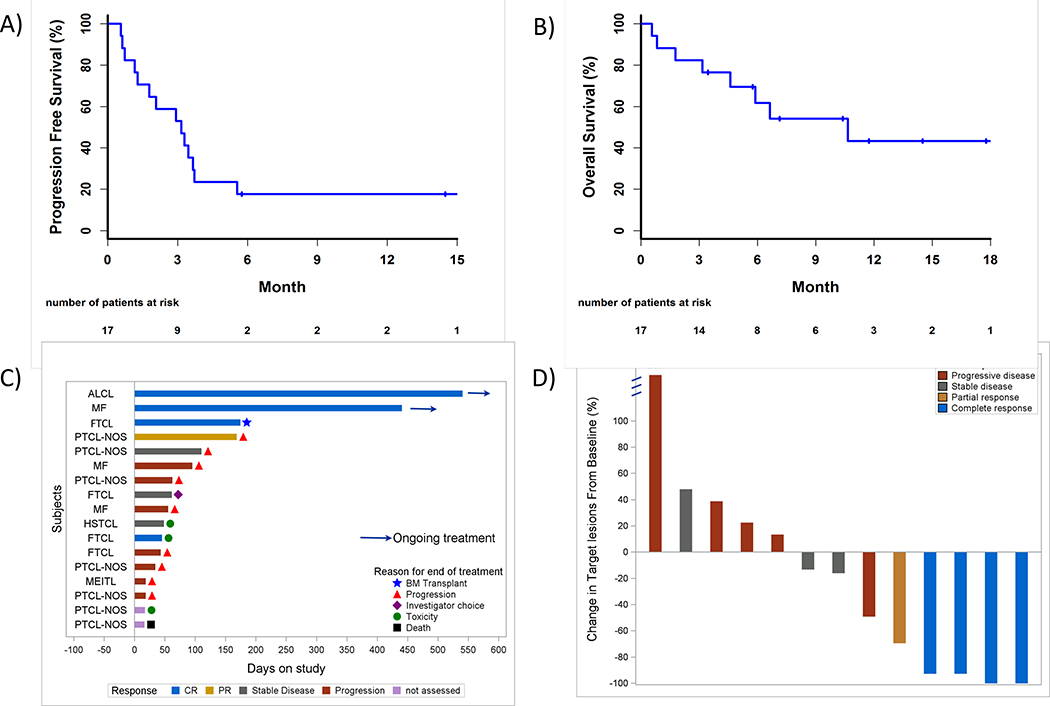
Fig. 2. Treatment outcomes.
Kaplan-Meier curves for A) Progression-free survival and B) Overall survival. Swimmer plot in C) demonstrates response duration, where each bar represents 1 subject and the length of the bar represents length of time on study. Best percent change in tumor volume is shown in D).

