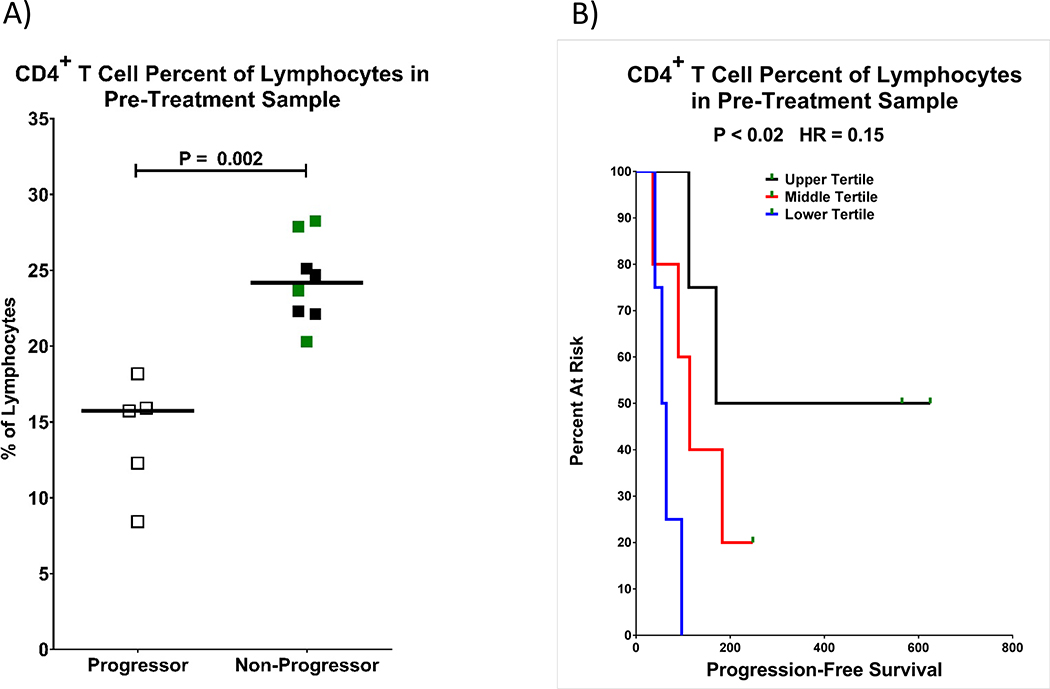
Fig. 3. Relative percentage of CD4+ T lymphocytes and outcomes.
Patients who started out with a higher relative percentage of peripheral blood CD4+ T cells had a lower risk of progression. CD4+ T cells are gated as viable, CD45+ SSClow,CD3+ CD4+. A) CD4+ T cell percent of total lymphocytes (CD45+ SSClow) are shown with progressors as open squares and non-progressors as filled squares. Patients with a complete response are shown in green, while those with stable disease or partial response are shown in black. Statistical significance was measured with a Wilcoxon rank-sum test. B) Kaplan-Meyer curves of progression-free survival are shown as a function of CD4+ T cell percent of lymphocytes with the upper tertile in black, middle tertile in red, and lower tertile in blue. Green rectangles indicate censored data points. The P-value and hazard ratio were determined by a Cox proportional hazard regression.

