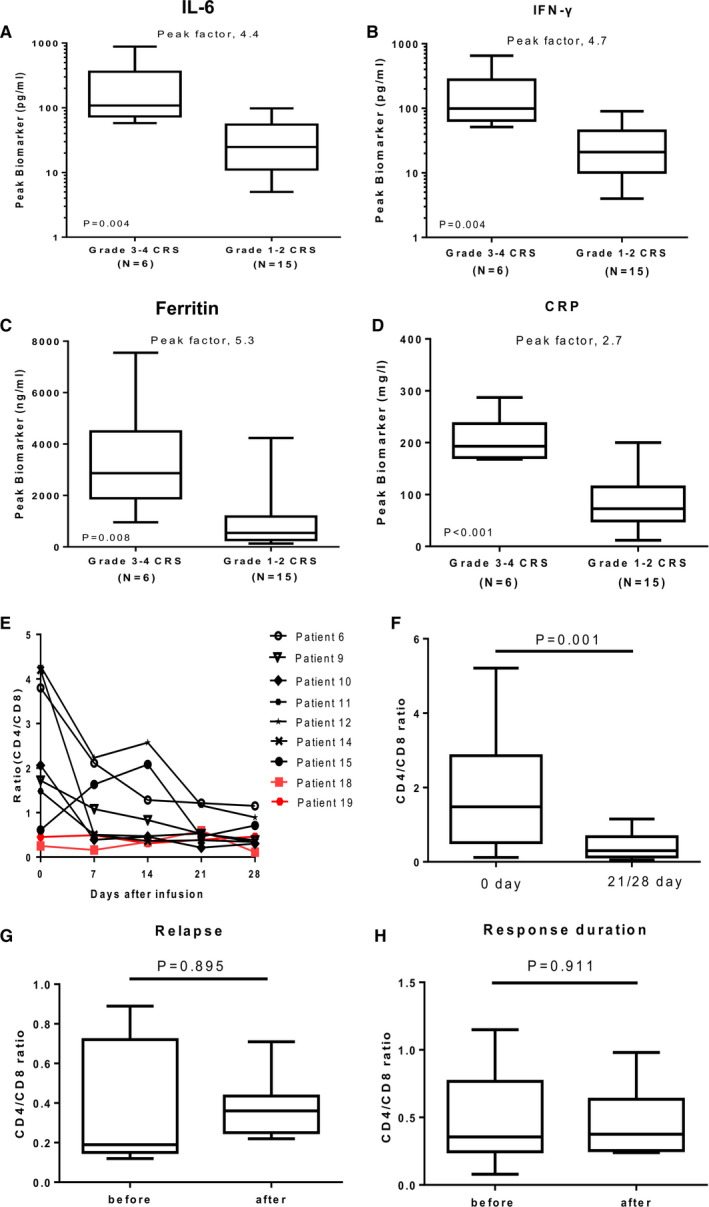
FIGURE 3.

Changes of serum biomarkers and CD4/CD8 ratio after CAR‐T cell infusion. (A‐D) IL‐6, IFN‐γ, ferritin, and CRP were associated only with CRS. The peak value is defined as the maximum level of the cytokine after baseline within a month of cell infusion. The peak factor is the value in patients with CRS of grade 3‐4 vs those with events of grade 1‐2. The horizontal line within each box represents the median, the lower and upper borders of each box represent the 25th and the 75th percentiles, respectively, and the I bars represent the minimum and maximum range. The Mann‐Whitney U test or t test was used for statistical analysis. (E) Dynamic changes of CD4/CD8 ratio in patients after CAR‐T cell infusion. P6, 9, 10, and 11 were CR patients, P12, 14, and 15 were PR patients, P18 was SD patient, and P19 was PD patient. (F) Dynamic changes of CD4/CD8 ratio in 17 patients with response. (G) Dynamic changes of CD4/CD8 ratio in 9/17 patients with relapse after CAR‐T cell infusion. (H) Dynamic changes of CD4/CD8 ratio in patients with response duration. The Wilcoxon rank‐sum test or t test were used for statistical analysis
