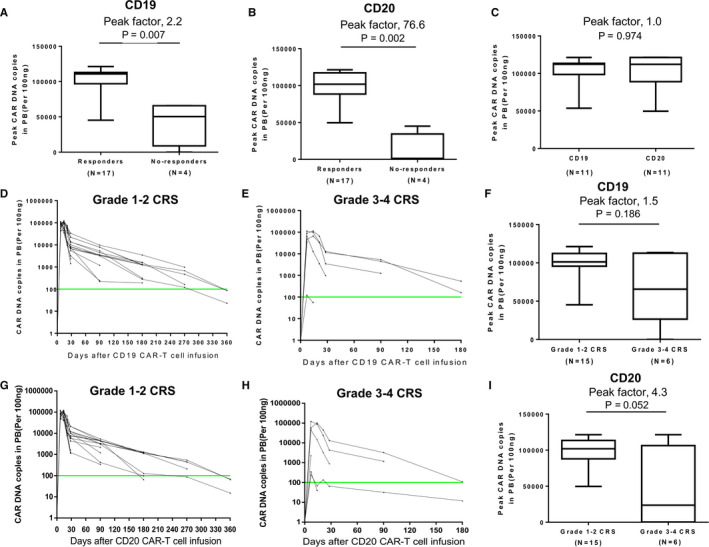
FIGURE 4.

Expansion and persistence of anti‐CD19 and anti‐CD20 CAR‐T cells in vivo. (A, B) Peak CAR DNA copies of anti‐CD19 and anti‐CD20 CAR‐T cells in the groups with response and without response. (C) Peak CAR DNA copies of anti‐CD19 CAR‐T cell and anti‐CD20 CAR‐T cell in patients of CR. (D, E) CAR DNA copies of anti‐CD19 CAR‐T cell at serial time points after infusion in patients who developed grade 1‐2 CRS and those who developed grade 3‐4 CRS. (F) Peak CAR DNA copies of anti‐CD19 CAR‐T cell in the groups with grade 1‐2 and grade 3‐4 CRS. (G, H) CAR DNA copies of anti‐CD20 CAR‐T cell at serial time points after infusion in patients who developed grade 1‐2 CRS and those who developed grade 3‐4 CRS. (I) Peak CAR DNA copies of anti‐CD20 CAR‐T cell in the groups with grade 1‐2 and grade 3‐4 CRS. The horizontal line at 100 copies per microgram of DNA represents the lower limit of quantification of this assay. The Mann‐Whitney U test was used for statistical analysis
